Fig. 3
Download original image
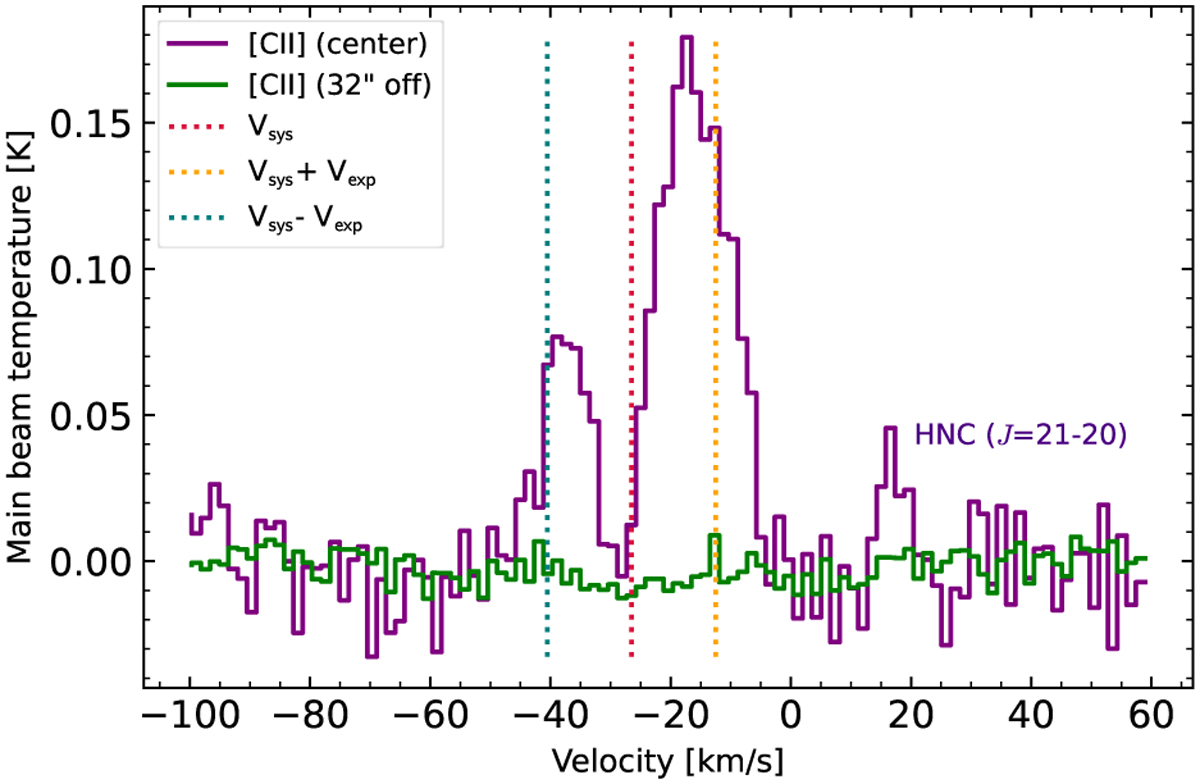
[C II] 2P3/2 → 2Pı/2 spectrum (2015–2021 average) towards the central line of sight. The average off-centre spectrum (at 32″ from the centre) is overlaid in green. The systemic velocity (Vsys) is marked with a red dotted line, and Vsys+Vexp and Vsys−Vexp values are marked with an orange and blue dotted line, respectively, where Vexp is the gas terminal expansion velocity. The emission feature at 15 km s−1 could be from the HNC J = 21−20 transition, and is marked as such.
Current usage metrics show cumulative count of Article Views (full-text article views including HTML views, PDF and ePub downloads, according to the available data) and Abstracts Views on Vision4Press platform.
Data correspond to usage on the plateform after 2015. The current usage metrics is available 48-96 hours after online publication and is updated daily on week days.
Initial download of the metrics may take a while.