Open Access
Fig. 9.
Download original image
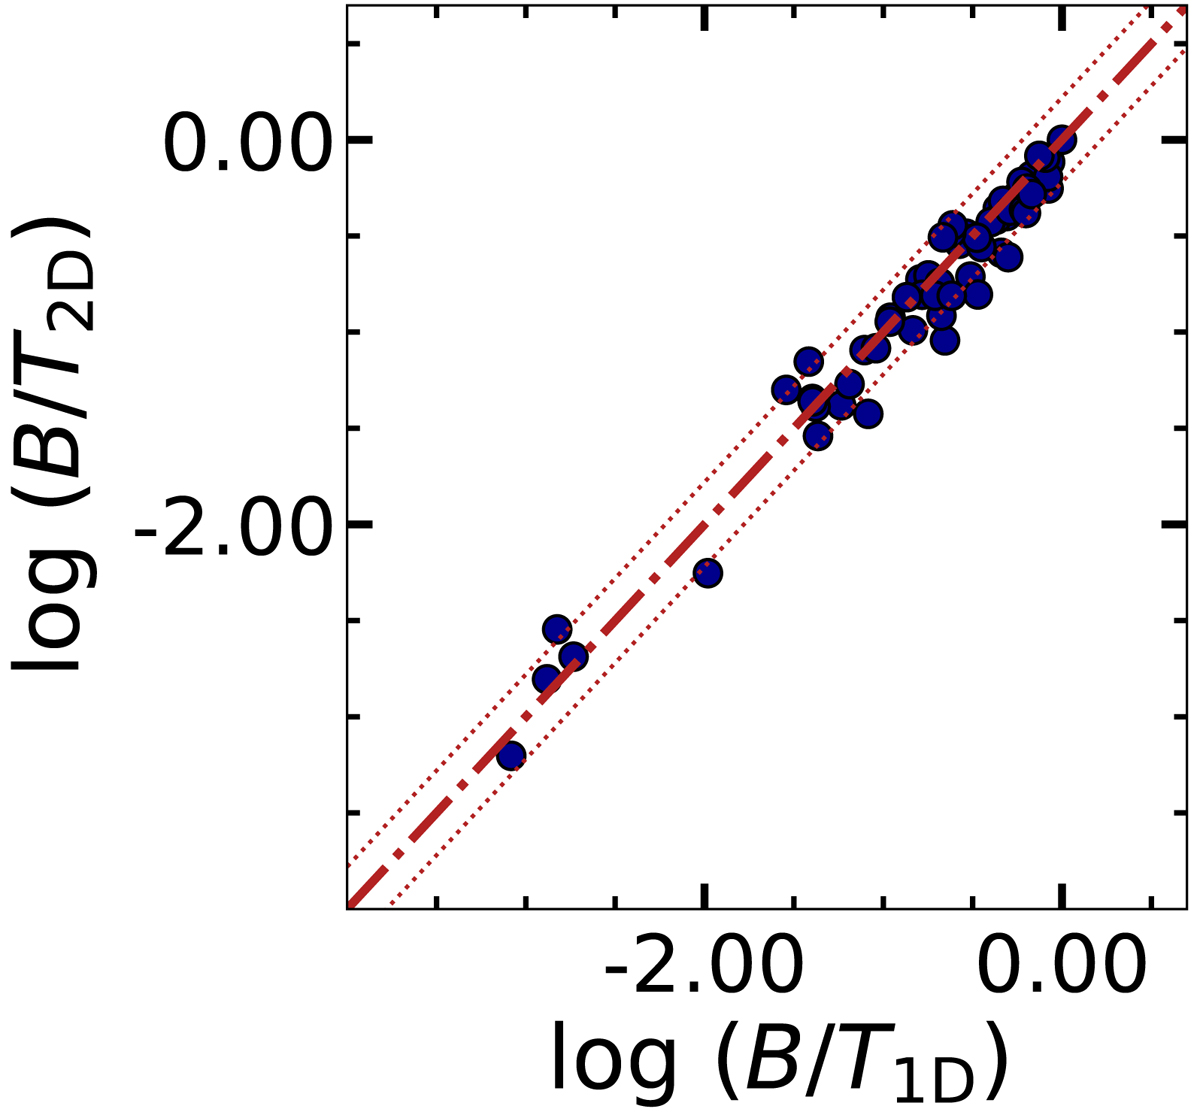
Comparison of the bulge-to-total ratios (B/T) from our 2D and 1D decompositions for 65 sample galaxies. The dashed-dotted line shows the one-to-one relations. The dotted lines show the σ uncertainty.
Current usage metrics show cumulative count of Article Views (full-text article views including HTML views, PDF and ePub downloads, according to the available data) and Abstracts Views on Vision4Press platform.
Data correspond to usage on the plateform after 2015. The current usage metrics is available 48-96 hours after online publication and is updated daily on week days.
Initial download of the metrics may take a while.