Fig. 4.

Download original image
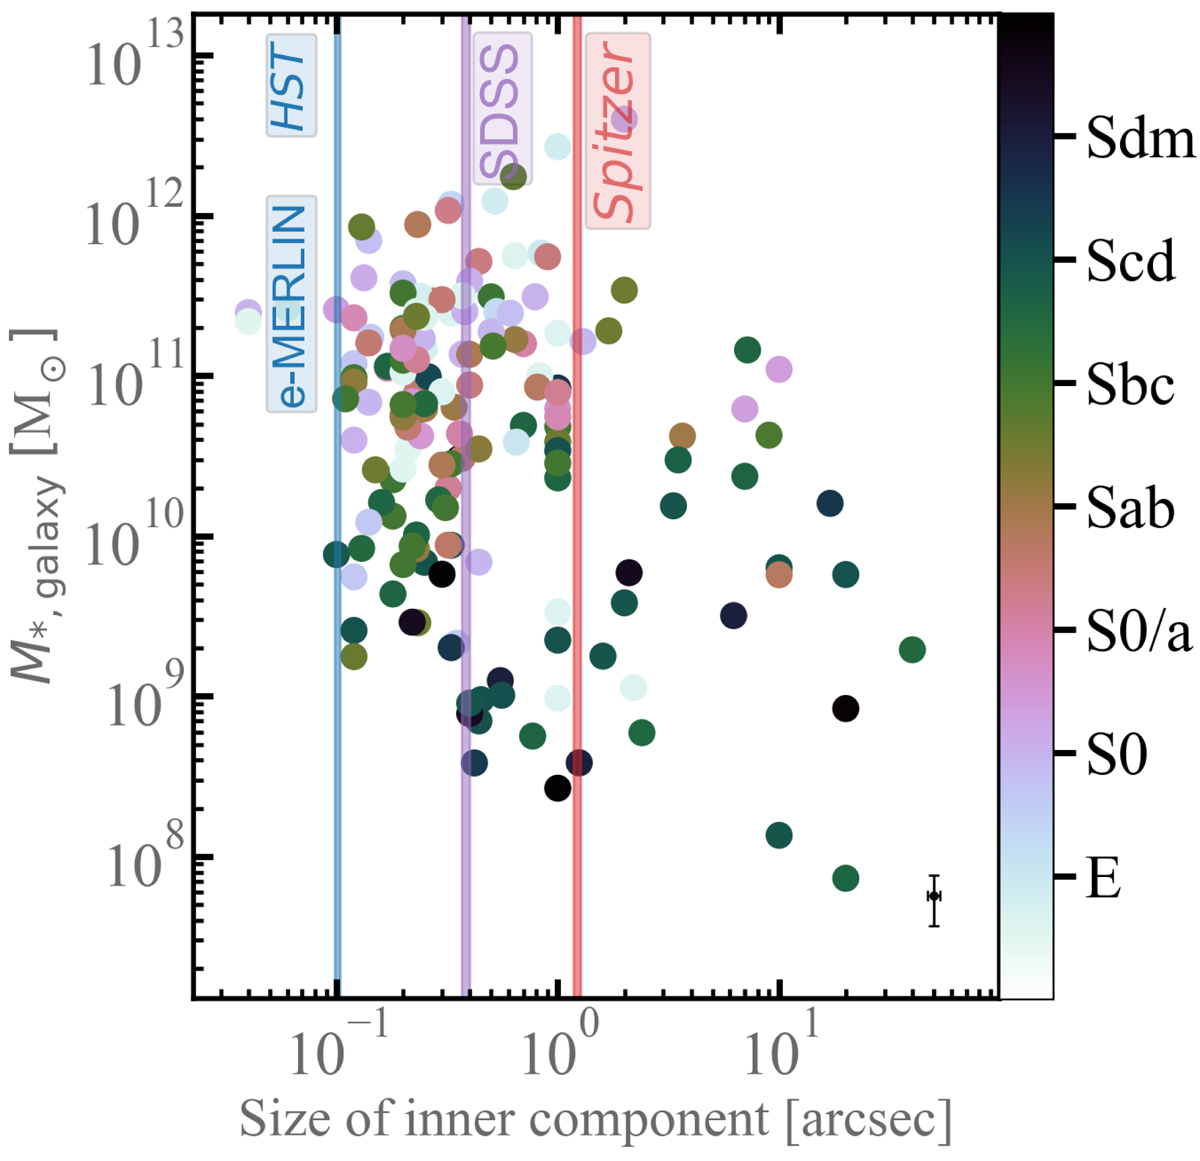
Distribution of inner, sub-kiloparsec stellar structures (point sources, nuclear star clusters, discs and rings, bars, and depleted stellar cores) detected in our photometric decompositions. The size of the sub-kiloparsec structure is defined to be the break radius for galaxies with a depleted core (i.e. core-Sérsic galaxies), whereas for others the size determined by eye from the fits indicates the radius where the sub-kiloparsec structure contributes significantly to the galaxy light. While a core-Sérsic galaxy can be nucleated, here we only consider its depleted core as a sub-kiloparsec structure. The overwhelming majority (95%) of our sample have sub-kiloparsec stellar structures that are detected in our analyses of the HST imaging with a high spatial resolution ![]() (blue vertical line). With high sensitivity e-MERLIN L-band (1.5 GHz) observations, we detected nuclear radio emission, at high resolution of
(blue vertical line). With high sensitivity e-MERLIN L-band (1.5 GHz) observations, we detected nuclear radio emission, at high resolution of ![]() , as such close comparison can be made with the analogous optical sub-kiloparsec structure in the HST data. The red and magenta vertical lines delineate the spatial resolutions for SDSS and Spitzer images. While we show the pixel scale of SDSS, the actual resolution is set by the seeing, that is typically larger than
, as such close comparison can be made with the analogous optical sub-kiloparsec structure in the HST data. The red and magenta vertical lines delineate the spatial resolutions for SDSS and Spitzer images. While we show the pixel scale of SDSS, the actual resolution is set by the seeing, that is typically larger than ![]() and varying across the sky. Accounting for the effect of the PSF, only 15% (22%) of the kiloparsec-scale structures from HST can be well resolved with Spitzer (SDSS) images. Furthermore, we see no clear trend between the physical size of the inner, sub-kiloparsec structures and total galaxy stellar mass (M*, glxy) or T-type. The total galaxy mass (M*, glxy) is based on our light profile decompositions (Table B.5) and the Hubble classes are based on the numerical T-type in HyperLEDA. A representative error bar is shown at the bottom.
and varying across the sky. Accounting for the effect of the PSF, only 15% (22%) of the kiloparsec-scale structures from HST can be well resolved with Spitzer (SDSS) images. Furthermore, we see no clear trend between the physical size of the inner, sub-kiloparsec structures and total galaxy stellar mass (M*, glxy) or T-type. The total galaxy mass (M*, glxy) is based on our light profile decompositions (Table B.5) and the Hubble classes are based on the numerical T-type in HyperLEDA. A representative error bar is shown at the bottom.
Current usage metrics show cumulative count of Article Views (full-text article views including HTML views, PDF and ePub downloads, according to the available data) and Abstracts Views on Vision4Press platform.
Data correspond to usage on the plateform after 2015. The current usage metrics is available 48-96 hours after online publication and is updated daily on week days.
Initial download of the metrics may take a while.


