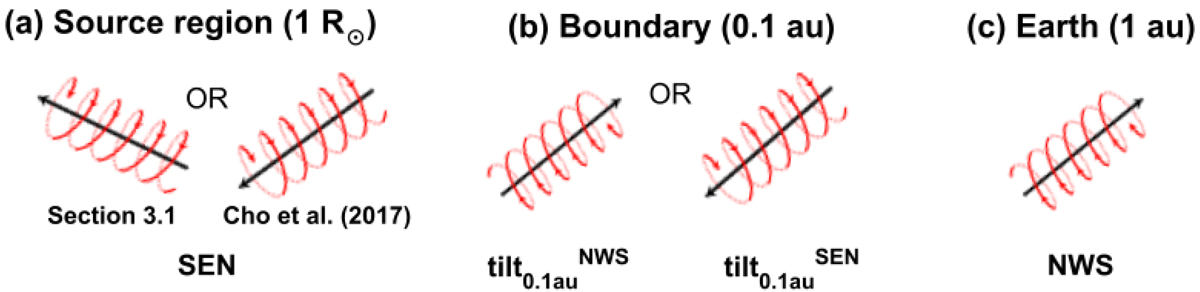
Fig. 8.
Download original image
Schematic representation of the CME2 orientation inferred from different observational proxies at different locations. (a) Close to 1 R⊙, based on the analysis of the source region in Sect. 3.1 and the analysis of Cho et al. (2017); (b) close to 0.1 au, based on the 3D reconstruction of the white-light images (Sect. 3.3); and (c) at 1 au, based on the in situ observations (Sect. 4).
Current usage metrics show cumulative count of Article Views (full-text article views including HTML views, PDF and ePub downloads, according to the available data) and Abstracts Views on Vision4Press platform.
Data correspond to usage on the plateform after 2015. The current usage metrics is available 48-96 hours after online publication and is updated daily on week days.
Initial download of the metrics may take a while.