Fig. 6.
Download original image
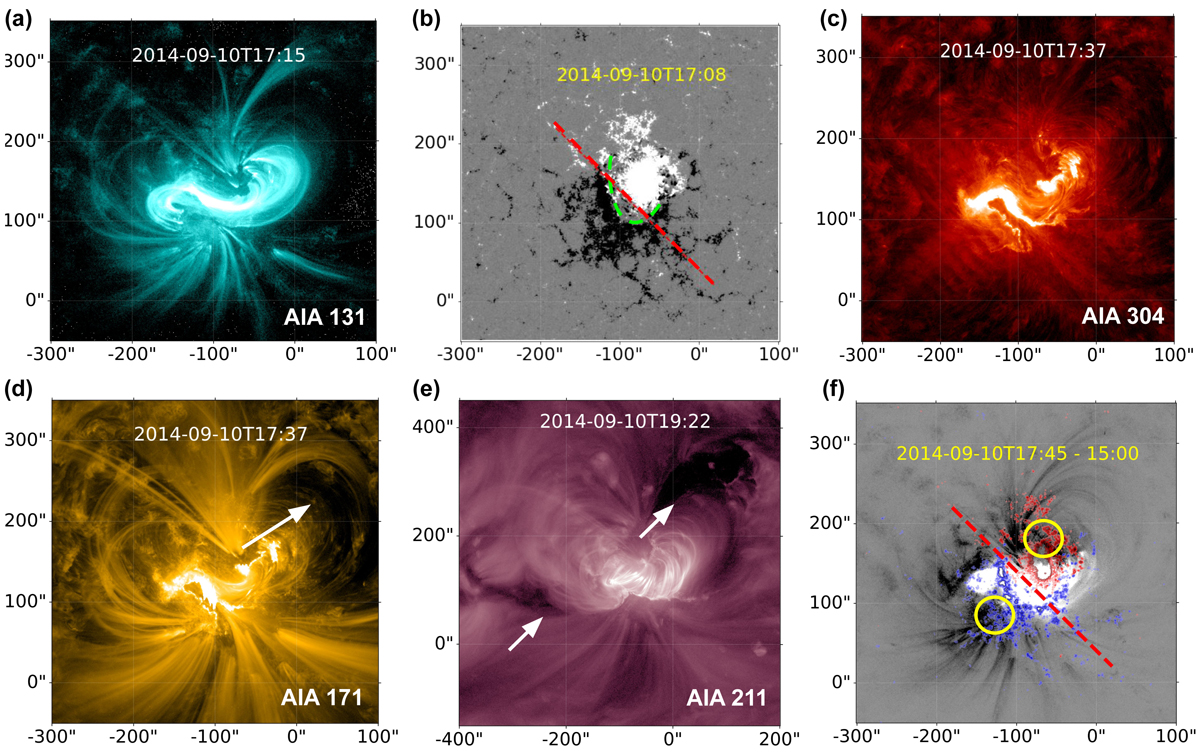
AR 12158 associated with CME2 eruption in different wavelengths. (a) AIA 131 Å image before CME2 eruption. (b) HMI magnetogram saturated at ±200 G overlaid with the approximated PIL drawn with a red dashed line. (c) AIA 304 Å image highlights the inverse J-shaped flare ribbons indicating left-handedness of the flux rope. (d) AIA 171 Å image showing the coronal loops and the eruption direction of CME2 in north-westward direction as per Dudík et al. (2016). (e) AIA 211 Å image showing coronal dimmings marked with white arrows. (f) AIA 131 Å base-difference image overlaid with HMI magnetogram contours saturated at ±1000 G coloured blue and red for negative and positive polarity, respectively. The yellow circles demarcate the dimmings located at the footpoints of the FR. The red dashed line is the approximated PIL. The X- and Y-axes correspond to the helio-projective longitude and latitude, respectively.
Current usage metrics show cumulative count of Article Views (full-text article views including HTML views, PDF and ePub downloads, according to the available data) and Abstracts Views on Vision4Press platform.
Data correspond to usage on the plateform after 2015. The current usage metrics is available 48-96 hours after online publication and is updated daily on week days.
Initial download of the metrics may take a while.