Fig. 5.
Download original image
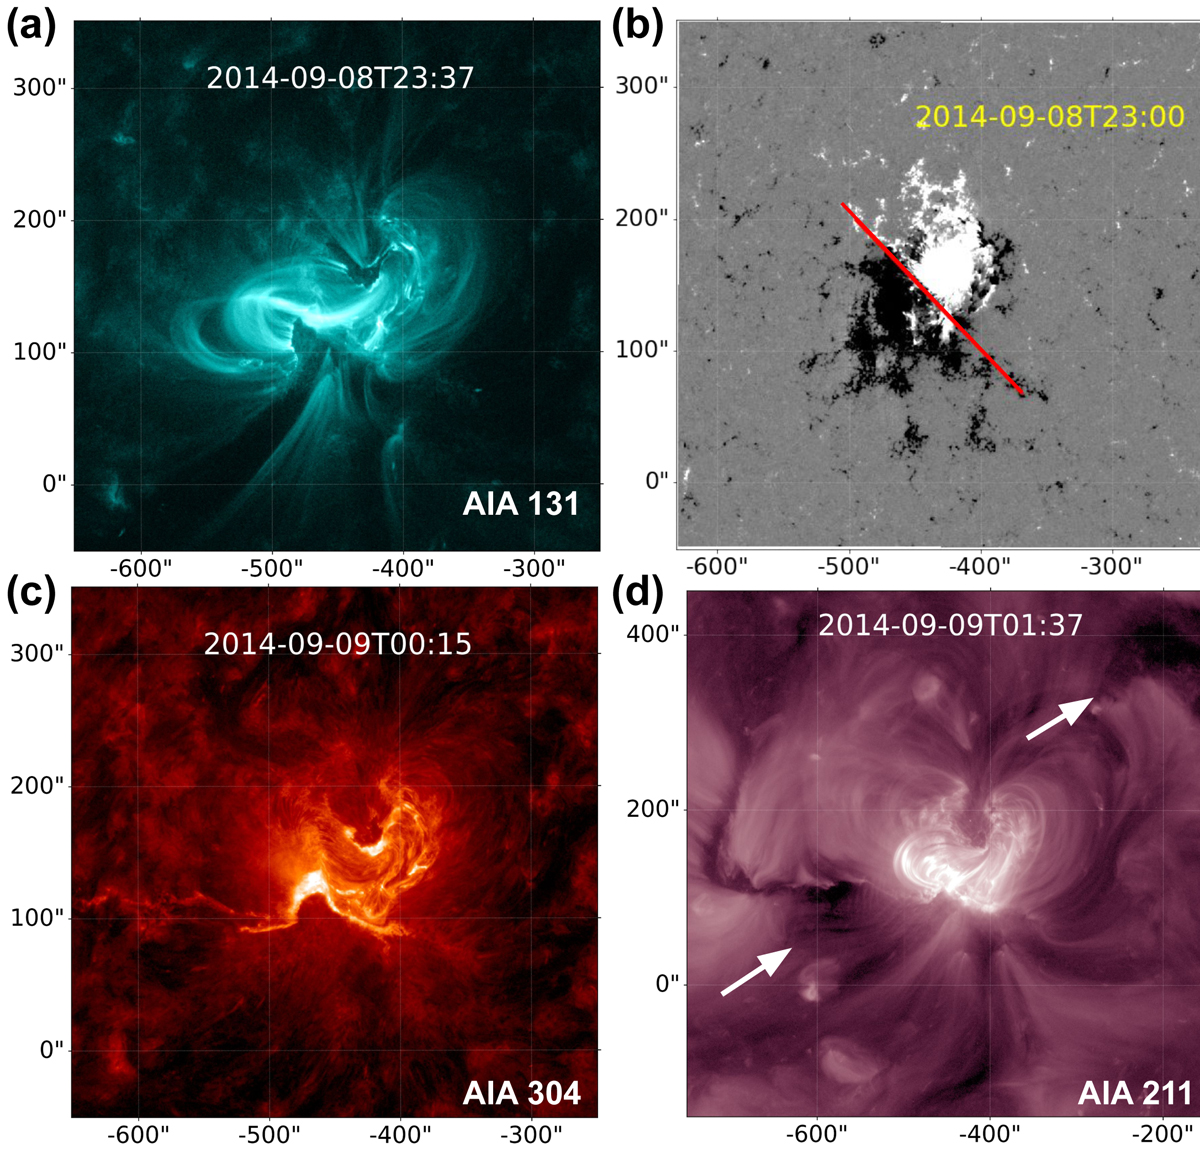
AR 12158 associated with CME1 eruption in different wavelengths. (a) AIA 131 Å image highlighting the evolved sigmoid and the hooks corresponding to flux rope footpoints during the early phase of the flare. (b) HMI magnetogram saturated at ±200 G overlaid with the approximated PIL orientation (i.e. the part of the extended PIL that most likely erupted as CME1), before the start of the flare. (c) AIA 304 Å image showing the inverse J-shaped flare ribbons after the eruption, which suggest the eruption of a left-handed flux rope. (d) AIA 211 Å image showing the post-flare coronal dimmings (marked with white arrows). The X- and Y-axes correspond to the helio-projective longitude and latitude, respectively.
Current usage metrics show cumulative count of Article Views (full-text article views including HTML views, PDF and ePub downloads, according to the available data) and Abstracts Views on Vision4Press platform.
Data correspond to usage on the plateform after 2015. The current usage metrics is available 48-96 hours after online publication and is updated daily on week days.
Initial download of the metrics may take a while.