Fig. 4.
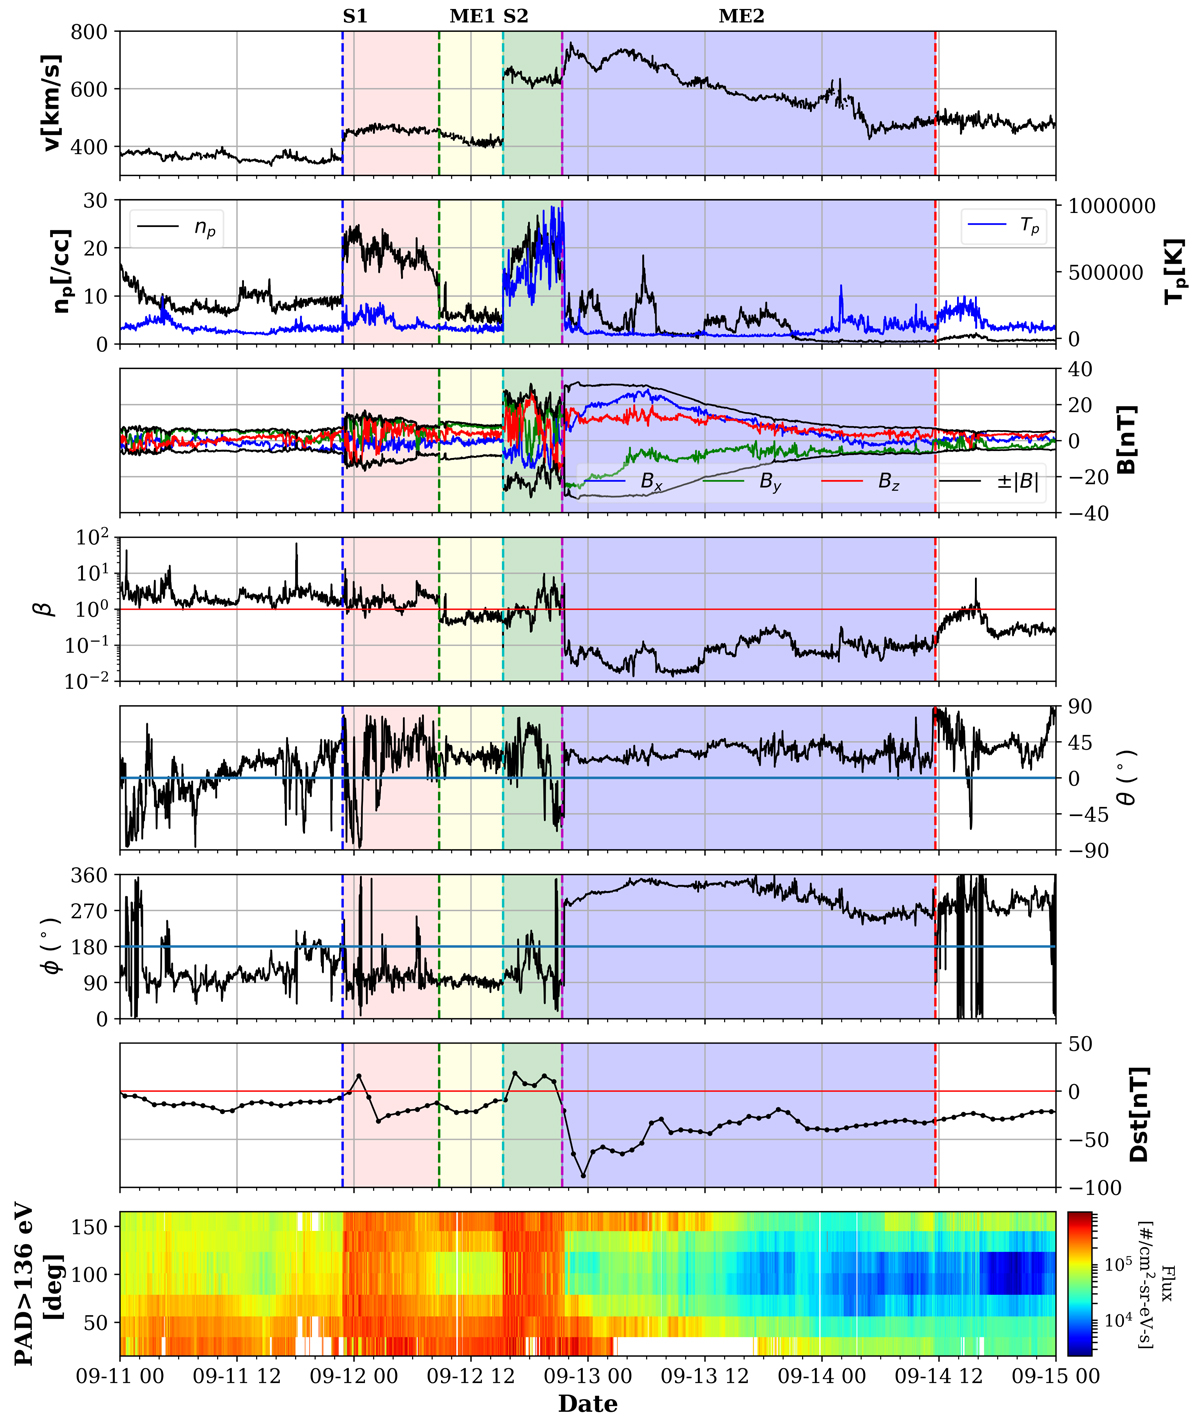
Download original image
In situ measurements by the Wind spacecraft during the period of September 11, 2014, and September 15, 2014. The figure shows (top to bottom) speed (v); proton temperature (Tp) and number density (np) in the second panel; magnetic field components (Bx, By, Bz) in the GSE coordinate system capped with the total magnetic field (±|B|) in the third panel; plasma beta (β) in the fourth panel; the θ and ϕ components of the magnetic field in GSE angular coordinates in the fifth and sixth panels, respectively; the Dst index in the seventh panel; and the suprathermal pitch angle distribution (with energies > 136 eV) in the bottom panel. Vertical dashed lines indicate the shock arrival of CME1 (S1, blue) and the start of the magnetic ejecta passage of CME1 (ME1, green). The shock arrival of CME2 (S2, cyan), the start of the magnetic ejecta passage of CME2 (magenta), and the end of the magnetic ejecta passage (red) are as identified in the Wind ICME catalogue. The shaded red and yellow regions represent the sheath ahead of CME1 and the magnetic ejecta, ME1, respectively. The shaded green and blue regions depict the sheath ahead of the CME2 and the magnetic ejecta, ME2. The magnetic ejecta of CME2 has been identified in the Richardson and Cane catalogue as well.
Current usage metrics show cumulative count of Article Views (full-text article views including HTML views, PDF and ePub downloads, according to the available data) and Abstracts Views on Vision4Press platform.
Data correspond to usage on the plateform after 2015. The current usage metrics is available 48-96 hours after online publication and is updated daily on week days.
Initial download of the metrics may take a while.