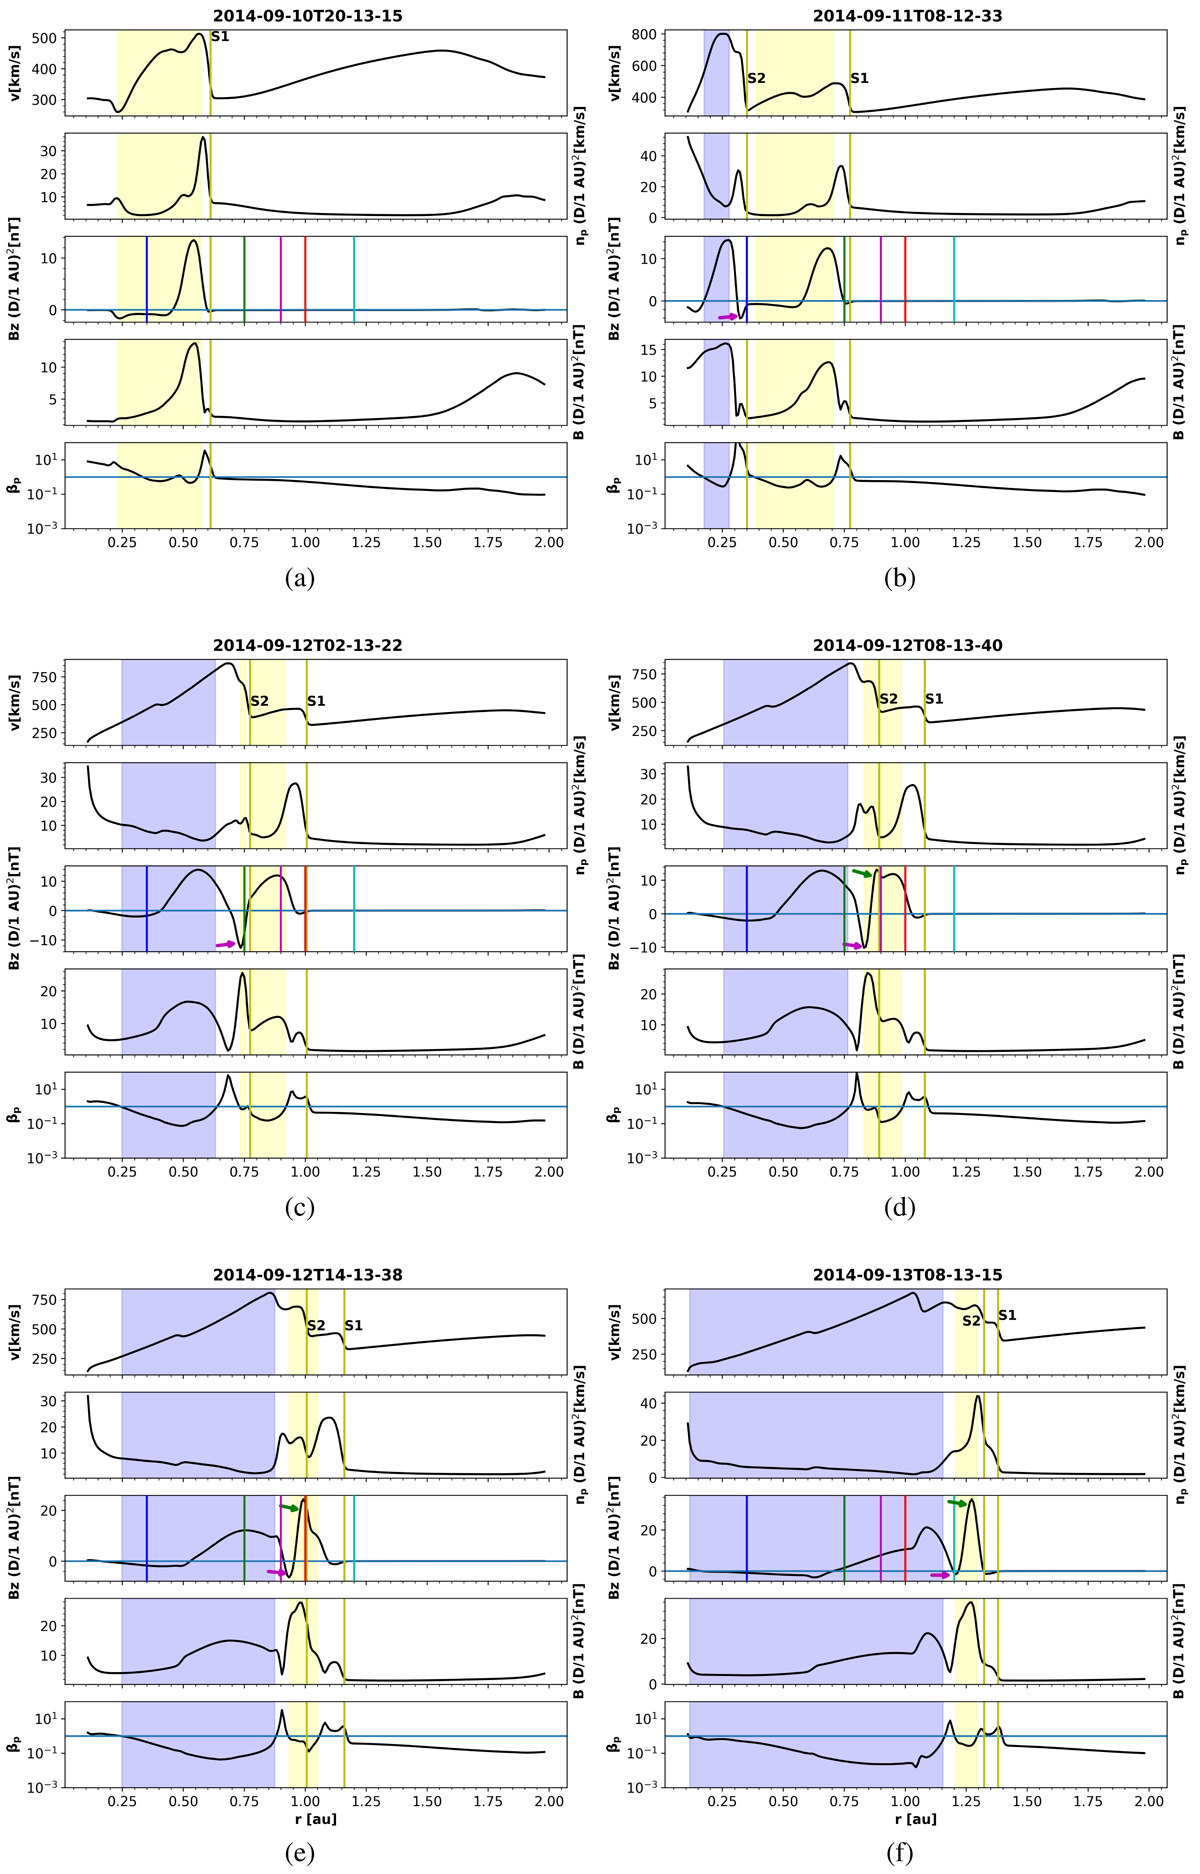
Fig. 13.
Download original image
Radial evolution profile of the CME1 and CME2 along the Sun–Earth line at different times of propagation and interaction extracted from Run4. Top to bottom (in each plot): speed (v), proton number density (np), z-component of magnetic field (Bz), total magnetic field (B), and proton plasma beta (βp). The yellow and blue shaded areas depict the extent of magnetic ejecta of CME1 and CME2, respectively, extracted using the criterion βp < 1 (βp < 5 in (a)). All physical quantities except the speed are scaled by (D/1 au)2 where D is the radial distance from the Sun. The CME shocks (S1 and S2) are marked in yellow lines. The colourful vertical lines in the Bz panel correspond to different radial distances, which help to explain the various phases of Run4 (detailed in Sect. 6.3): (a) Propagation of CME1 alone in the heliosphere; (b) formation of a compressed negative Bz ejecta CE1a (shown with the magenta arrow); (c) further compression of CE1a; (d) development of a compressed positive Bz ejecta, CE1b (shown with a green arrow), ahead of CE1a; (e) further compression of CE1b; and (f) diffusion of CE1a (∼0 nT) upon reaching 1.2 au while CE1b undergoes further enhancement.
Current usage metrics show cumulative count of Article Views (full-text article views including HTML views, PDF and ePub downloads, according to the available data) and Abstracts Views on Vision4Press platform.
Data correspond to usage on the plateform after 2015. The current usage metrics is available 48-96 hours after online publication and is updated daily on week days.
Initial download of the metrics may take a while.