Fig. 12.
Download original image
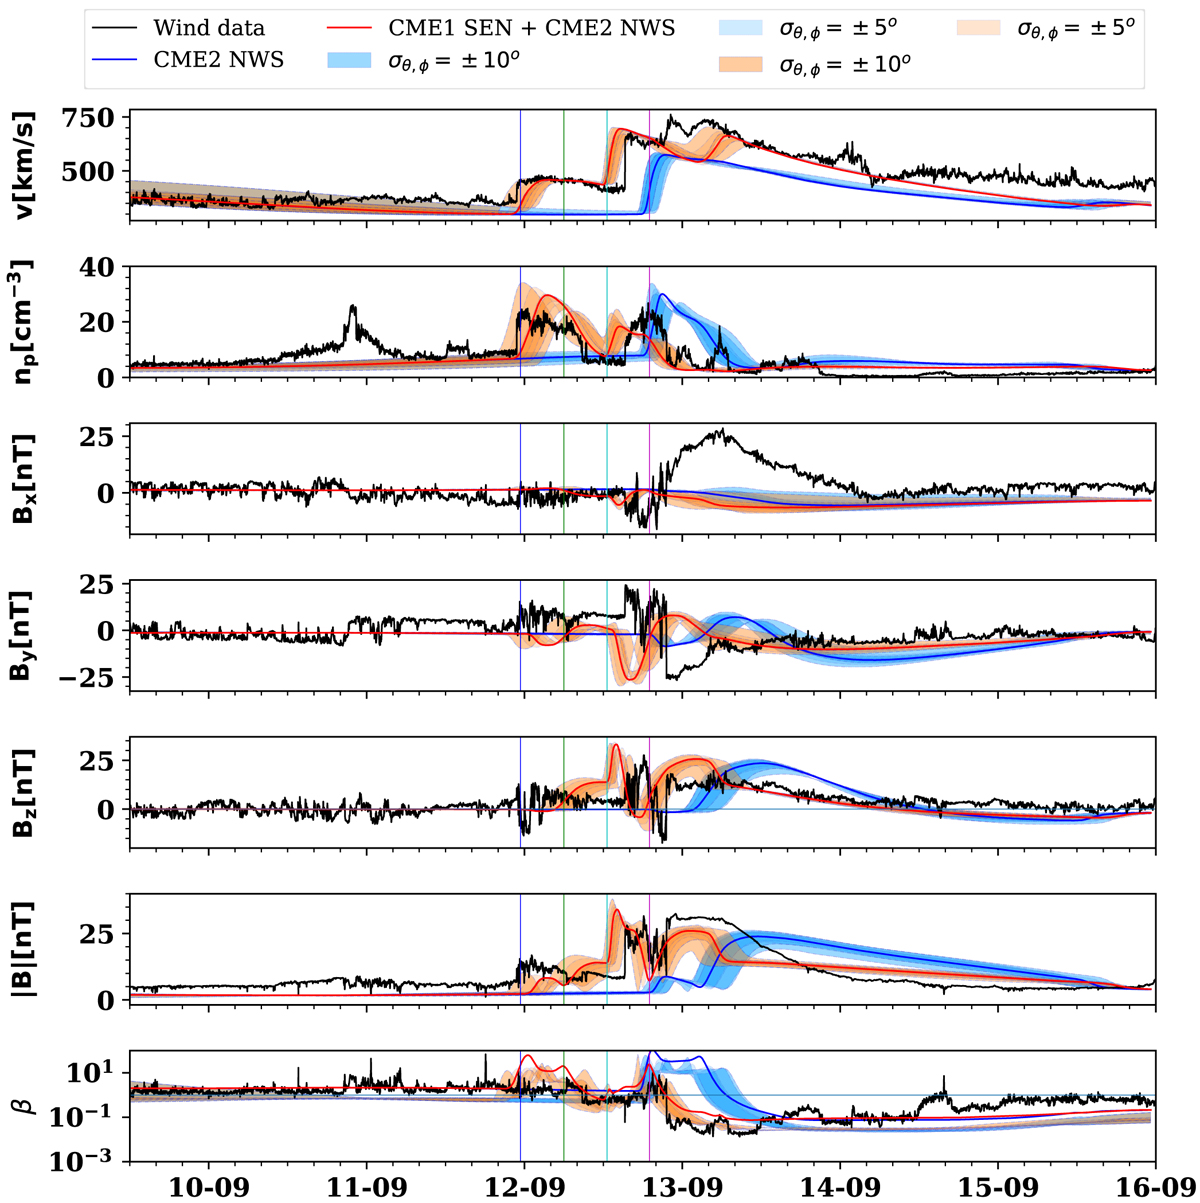
Results of Run2 (blue; CME2 NWS) and Run4 (red; CME1 SEN + CME2 NWS) are compared. CME1 and CME2 parameters in Run4 correspond to Run3 and Run2, respectively. Figure description is similar to Fig. 10. S1, the start of ME1, S2, and the start of ME2 are marked with blue, green, cyan, and magenta vertical lines, respectively, in Run4.
Current usage metrics show cumulative count of Article Views (full-text article views including HTML views, PDF and ePub downloads, according to the available data) and Abstracts Views on Vision4Press platform.
Data correspond to usage on the plateform after 2015. The current usage metrics is available 48-96 hours after online publication and is updated daily on week days.
Initial download of the metrics may take a while.