Fig. 10.
Download original image
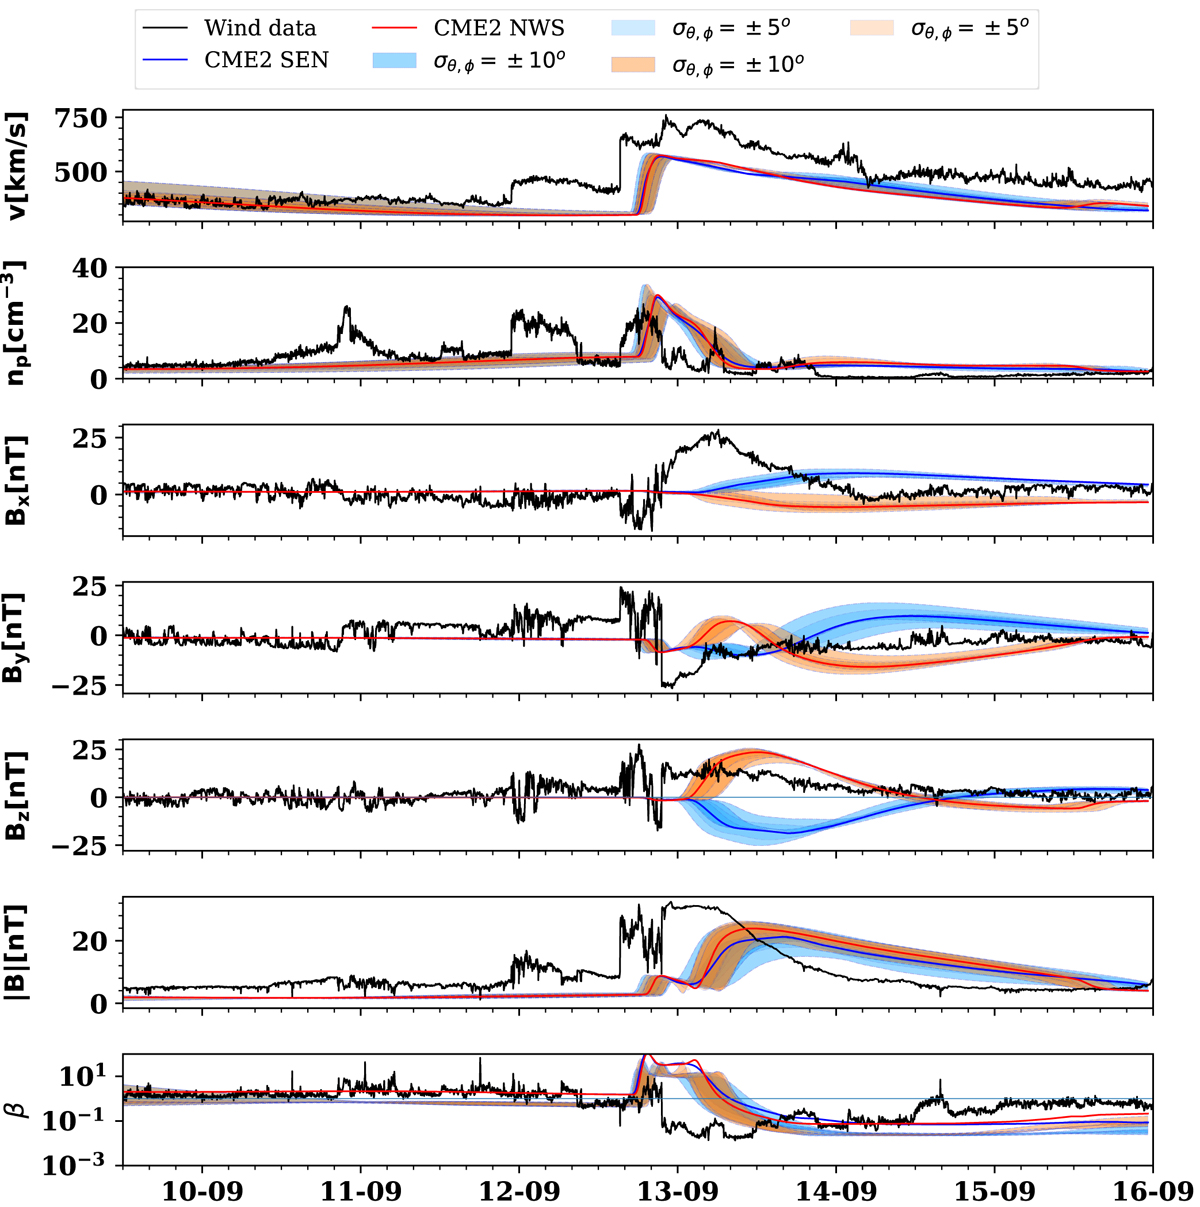
Time series plot showing a comparison between the simulations with different orientations of CME2 modelled with FRi3D, at Earth: Run1 (blue) is simulated with tilt![]() (deduced based on the orientation close to 1 R⊙) and Run2 (red) with tilt
(deduced based on the orientation close to 1 R⊙) and Run2 (red) with tilt![]() (similar to the tilt at 1 au). Both the orientations follow the same geometrical tilt derived from the 3D reconstruction at 0.1 au but with two different axial magnetic field orientations. From top to bottom: Speed (v), proton number density (np), Bx, By, Bz, magnetic field strength (|B|), and plasma beta (β). The solid line and the shaded regions show the profile at Earth and in the 5–10° latitudinal and longitudinal offset around Earth, respectively.
(similar to the tilt at 1 au). Both the orientations follow the same geometrical tilt derived from the 3D reconstruction at 0.1 au but with two different axial magnetic field orientations. From top to bottom: Speed (v), proton number density (np), Bx, By, Bz, magnetic field strength (|B|), and plasma beta (β). The solid line and the shaded regions show the profile at Earth and in the 5–10° latitudinal and longitudinal offset around Earth, respectively.
Current usage metrics show cumulative count of Article Views (full-text article views including HTML views, PDF and ePub downloads, according to the available data) and Abstracts Views on Vision4Press platform.
Data correspond to usage on the plateform after 2015. The current usage metrics is available 48-96 hours after online publication and is updated daily on week days.
Initial download of the metrics may take a while.