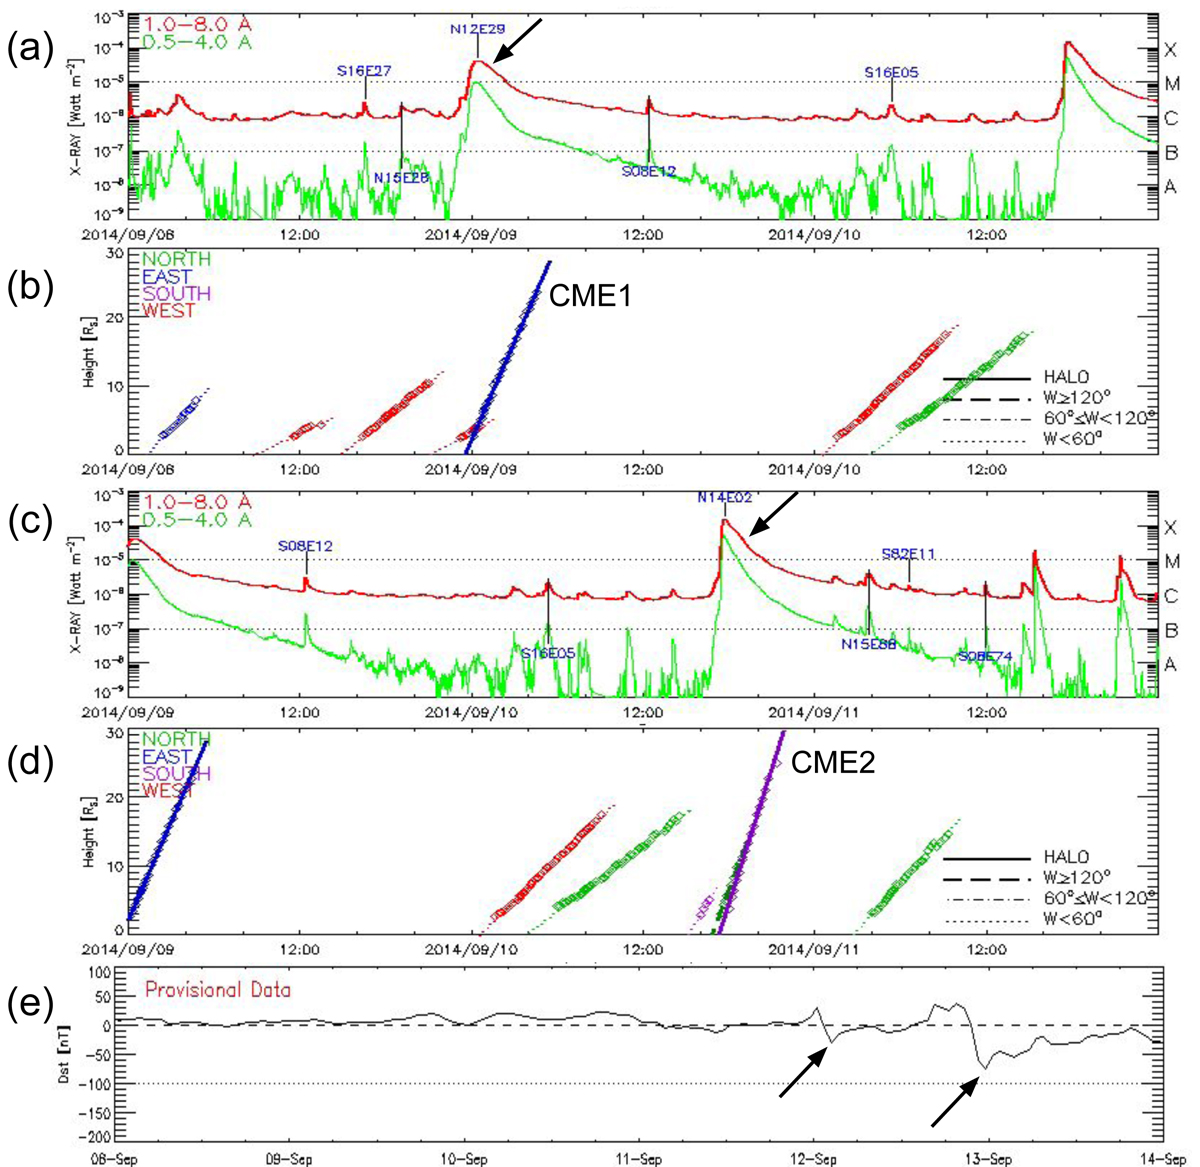
Fig. 1.
Download original image
Overview of the eruption, early evolution in corona, and geomagnetic signatures of CME1 and CME2. Panels (a,b) and panels (c,d) span the time ranges of September 8–10, 2014, and September 9–11, 2014, respectively. (a) M-class flare on late September 8, 2014 (indicated with black arrow), which can be associated with the eruption of CME1. (b) Height-time plot of CME1 shown by the blue height profile starting at ∼23.30 UT on September 8, 2014. (c) X-class flare on September 10 (indicated with black arrow), which can be associated with the eruption of CME2. (d) Height-time plot of CME2 shown by the purple height profile starting at ∼17.30 UT on September 9, 2014. The solar source coordinates of the flares are labelled in the GOES X-ray intensity plots in panels (a,c). The colour (line) codes in panels (b,d) define the CME propagation direction (apparent angular width). (e) Disturbance storm index (Dst), a measure of the geomagnetic activity at Earth shows a calm phase followed by a mild disturbance and then a moderate storm in the period 12-14 September, 2014 (disturbances indicated with arrows). Source: CDAW catalogue – https://cdaw.gsfc.nasa.gov/CME_list/daily_plots/sephtx/2014_09/
Current usage metrics show cumulative count of Article Views (full-text article views including HTML views, PDF and ePub downloads, according to the available data) and Abstracts Views on Vision4Press platform.
Data correspond to usage on the plateform after 2015. The current usage metrics is available 48-96 hours after online publication and is updated daily on week days.
Initial download of the metrics may take a while.