Open Access
Fig. 1
Download original image
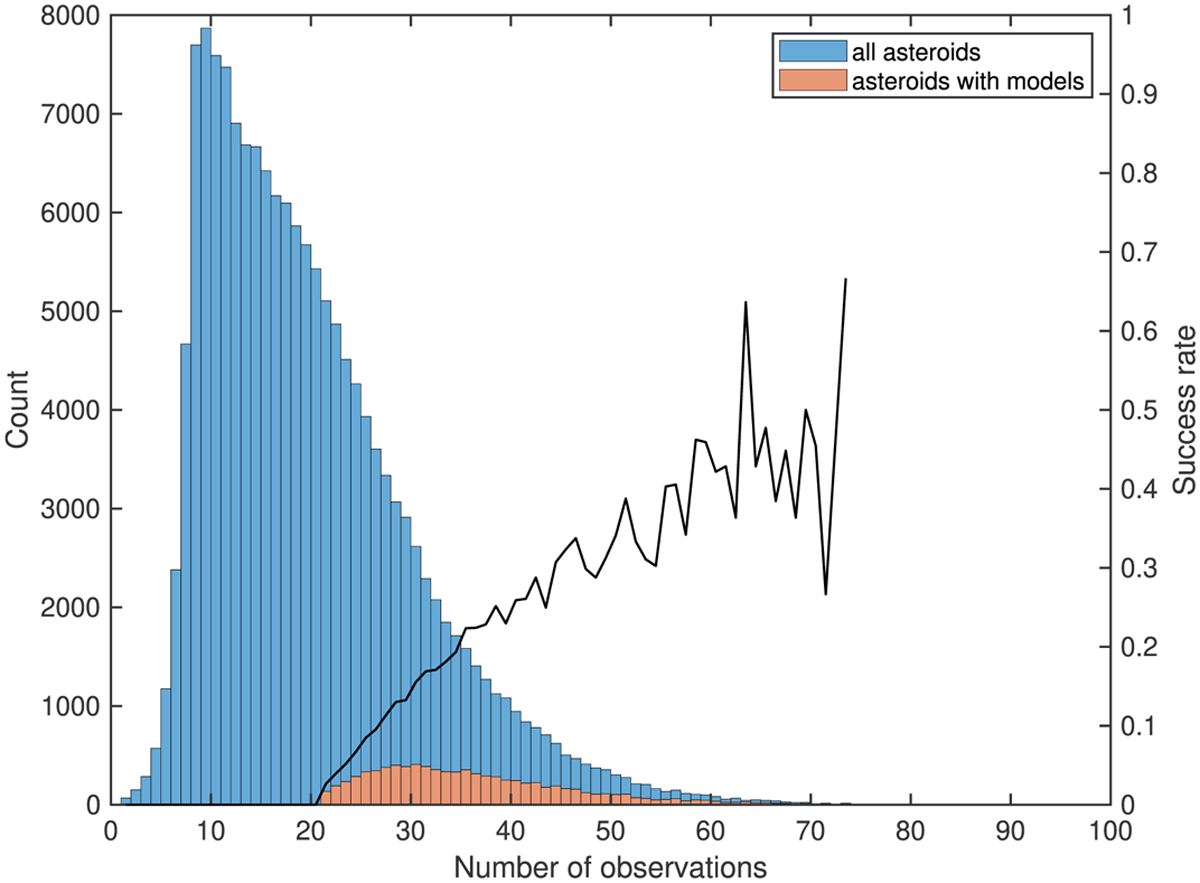
Histogram showing number distributions of observations per asteroid in the whole DR3 dataset (blue) and for asteroids for which we derived a spin and shape model (orange). The black curve shows the success rate of deriving a model for each data bin with at least ten counts, which is the ratio of the orange to blue bins.
Current usage metrics show cumulative count of Article Views (full-text article views including HTML views, PDF and ePub downloads, according to the available data) and Abstracts Views on Vision4Press platform.
Data correspond to usage on the plateform after 2015. The current usage metrics is available 48-96 hours after online publication and is updated daily on week days.
Initial download of the metrics may take a while.