Fig. 2
Download original image
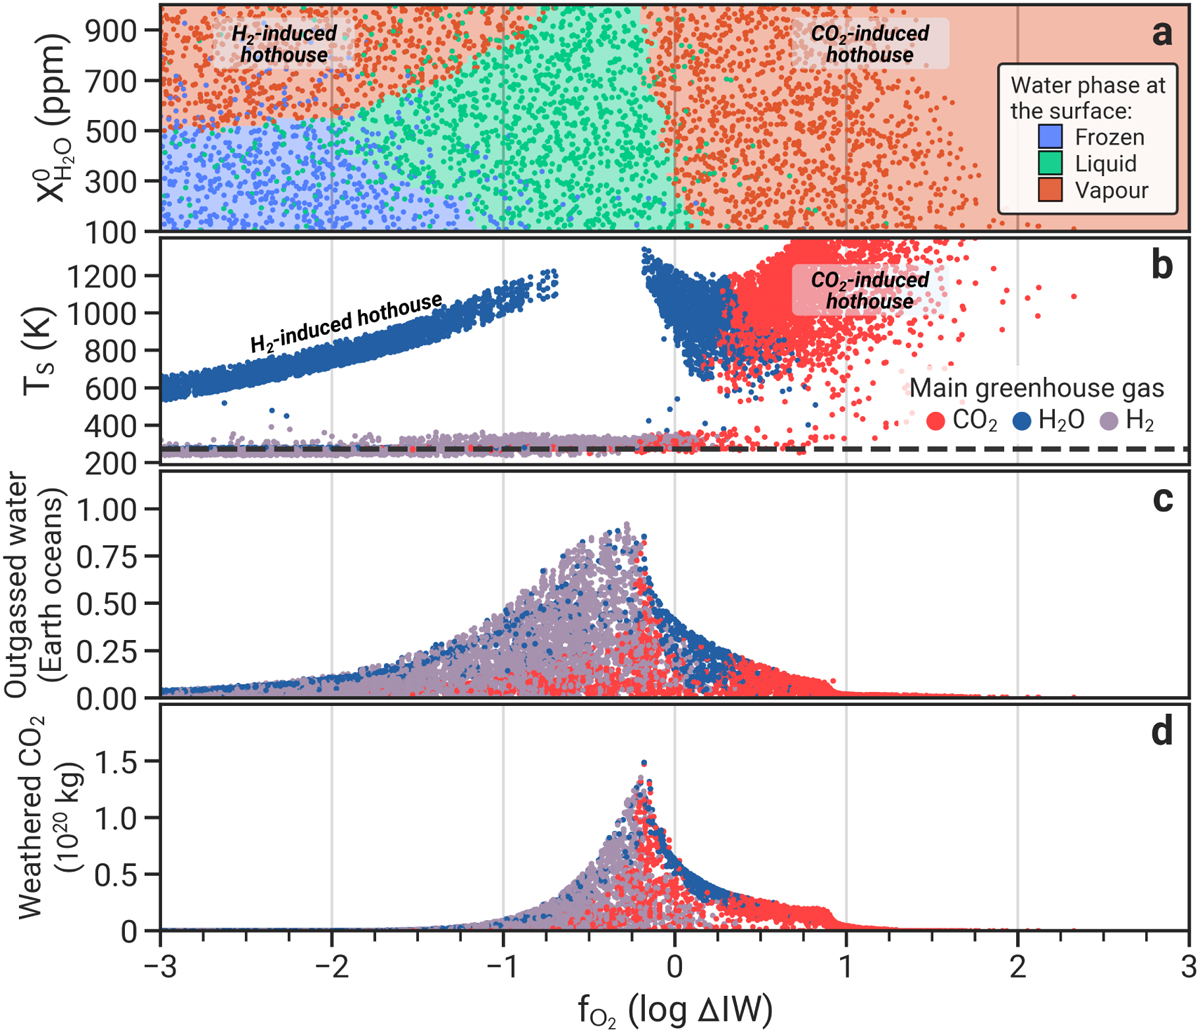
States of a stagnant-lid Earth as a function of the mantle oxygen fugacity. Each point represents a snapshot of the planetary evolution at a randomly selected planet age between 100 Myr and 8 Gyr. The colored points in panel a show the prevailing water phase at the surface as a function of the oxygen fugacity (![]() ) and initial water content of the mantle (
) and initial water content of the mantle (![]() ). The color background shows the area where the majority of neighboring data points share the same surface conditions. In panels b-d, points are colored according to the greenhouse gas that contributes most to surface heating. Panel b shows the surface temperature, panel c shows the total mass of outgassed water, and panel d shows the total mass of CO2 removed from the atmosphere via weathering.
). The color background shows the area where the majority of neighboring data points share the same surface conditions. In panels b-d, points are colored according to the greenhouse gas that contributes most to surface heating. Panel b shows the surface temperature, panel c shows the total mass of outgassed water, and panel d shows the total mass of CO2 removed from the atmosphere via weathering.
Current usage metrics show cumulative count of Article Views (full-text article views including HTML views, PDF and ePub downloads, according to the available data) and Abstracts Views on Vision4Press platform.
Data correspond to usage on the plateform after 2015. The current usage metrics is available 48-96 hours after online publication and is updated daily on week days.
Initial download of the metrics may take a while.