Fig. G.3
Download original image
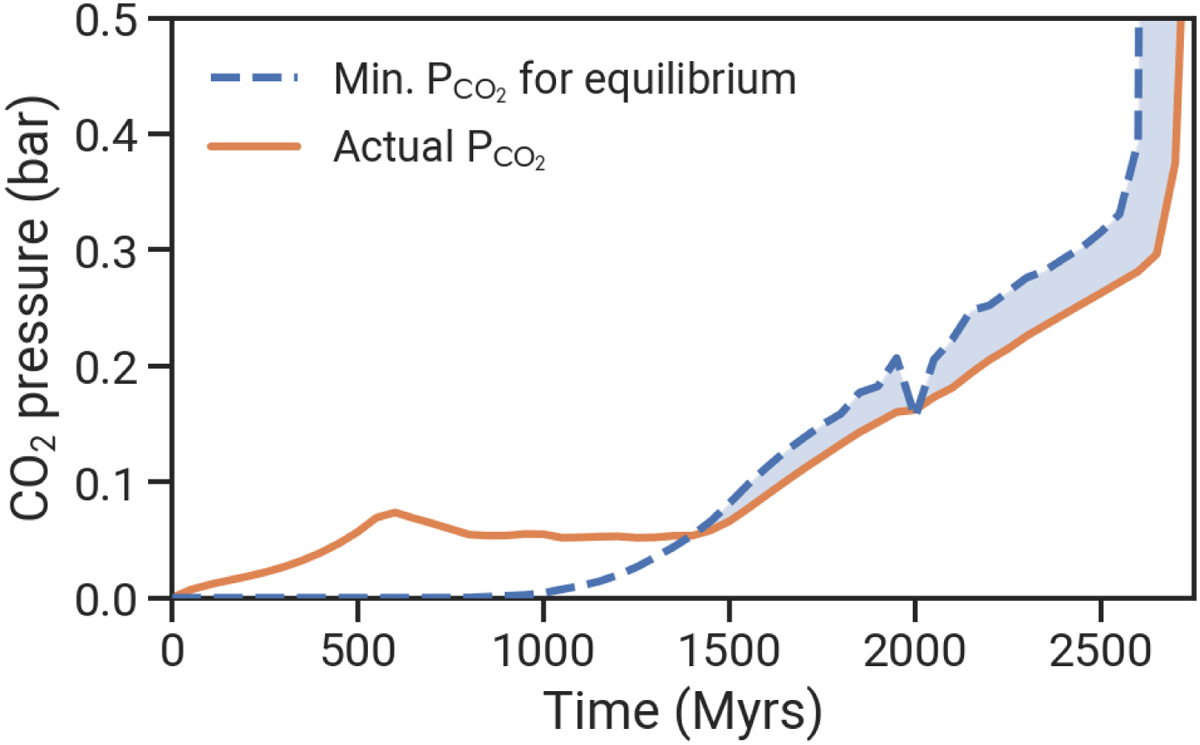
Example of limited weathering due to limited crustal growth. The blue dashed line shows the partial pressure of CO2 which would be necessary for weathering to be in equilibrium with the influx of CO2 from outgassing and decarbonation, based on the current crustal growth rate. The orange line shows the actual CO2 pressure in the atmosphere. The blue shaded region marks where the system is in disequilibrium, where the influx of C02 is larger than can be removed by weathering. This example correspond to the Earth-like model in Fig. 1a–c.
Current usage metrics show cumulative count of Article Views (full-text article views including HTML views, PDF and ePub downloads, according to the available data) and Abstracts Views on Vision4Press platform.
Data correspond to usage on the plateform after 2015. The current usage metrics is available 48-96 hours after online publication and is updated daily on week days.
Initial download of the metrics may take a while.