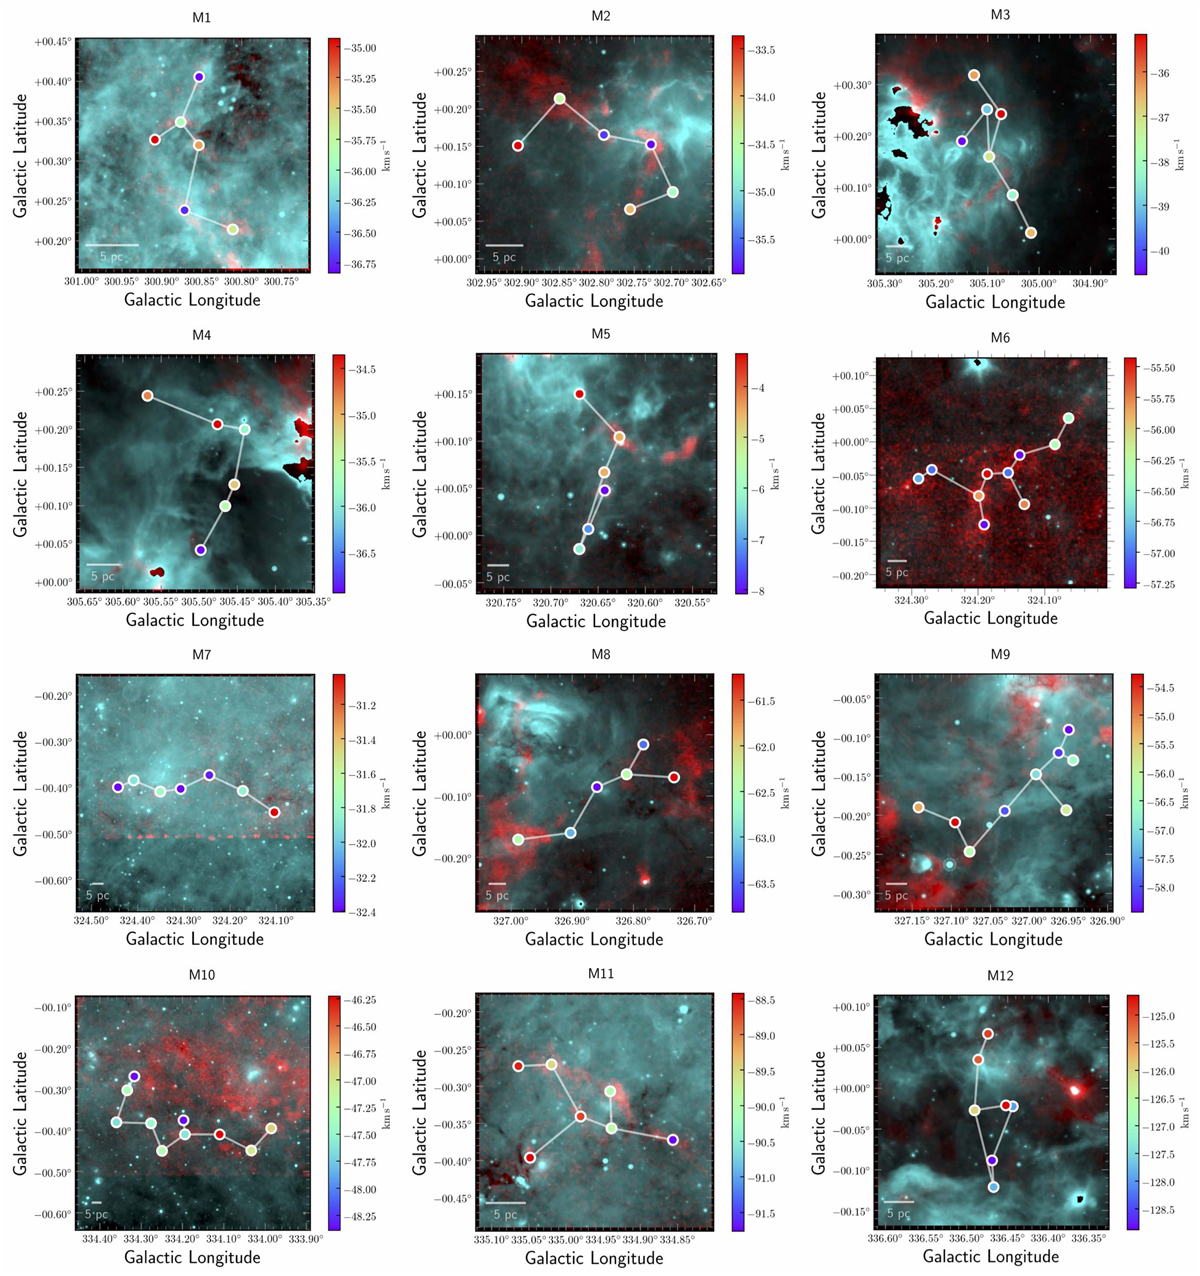
Fig. E.1
Download original image
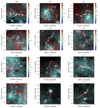
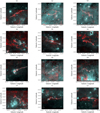
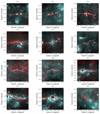
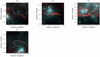
Two-color view of filaments. The color-coded circles denote leaves in filaments with different velocities. For M1-M55, the white line segments are edges. For S56-S88, the white curves are their medial axis. For backgrounds, cyan represents intermediate infrared 24 μm emission on a logarithmic scale from MIPSGAL (Carey et al. 2009) and red shows s integrated 13CO(2−1) emission.
Current usage metrics show cumulative count of Article Views (full-text article views including HTML views, PDF and ePub downloads, according to the available data) and Abstracts Views on Vision4Press platform.
Data correspond to usage on the plateform after 2015. The current usage metrics is available 48-96 hours after online publication and is updated daily on week days.
Initial download of the metrics may take a while.