Fig. 3
Download original image
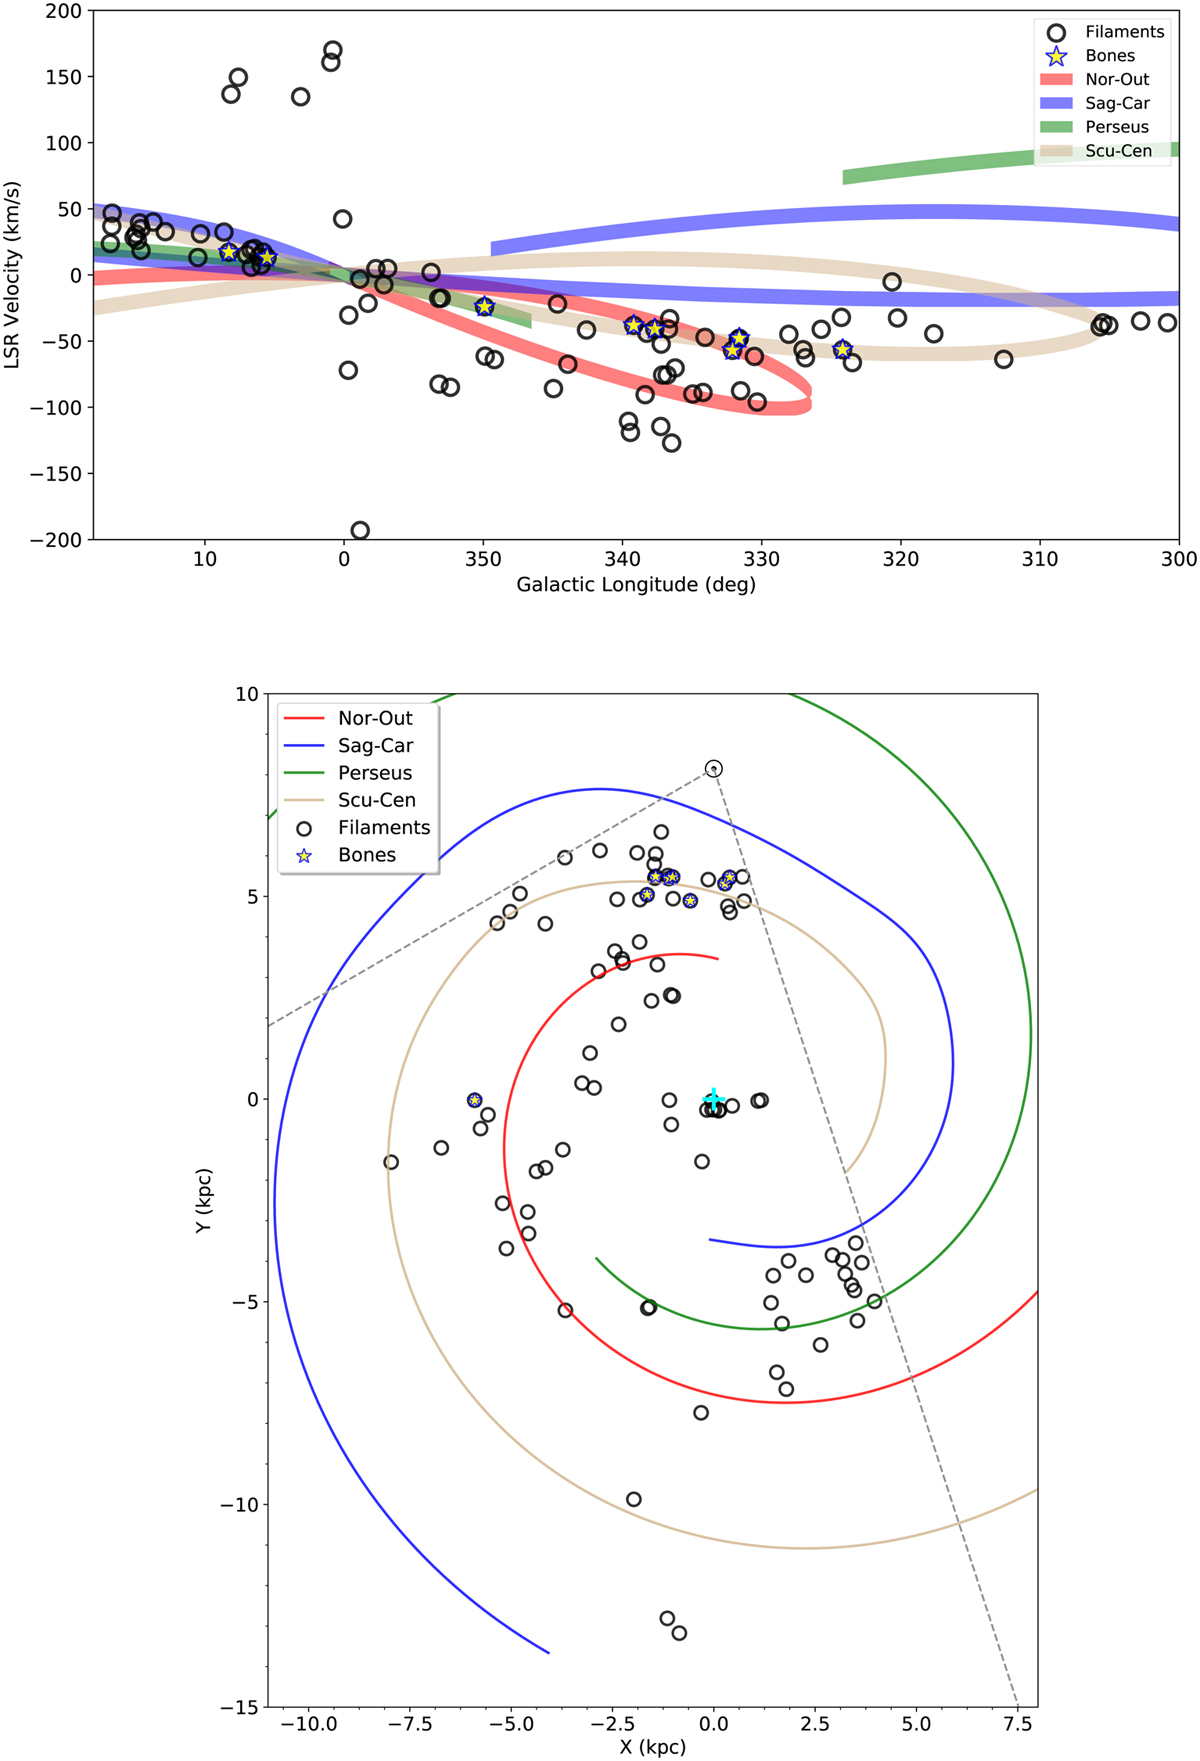
Distribution of large-scale filaments with respect to spiral arms. The top panel is a longitude-velocity view of filaments and spiral arms. Belts with various colors are arms in Taylor & Cordes (1993) model, and widths are 10 km s−1. Red, brown, blue, and green represent the Norma-Outer, Scutum-Centaurus, Sagittarius-Carina, and Perseus arms, respectively. Black circles denote our filaments and stars are “bones”. The bottom panel shows a face-on view of filaments and spiral arms. The cyan plus symbol represents the Galactic center, and grey dashed lines show the data range. The solar symbol ⊙ is plotted at (0, 8.15) kpc (Reid et al. 2019).
Current usage metrics show cumulative count of Article Views (full-text article views including HTML views, PDF and ePub downloads, according to the available data) and Abstracts Views on Vision4Press platform.
Data correspond to usage on the plateform after 2015. The current usage metrics is available 48-96 hours after online publication and is updated daily on week days.
Initial download of the metrics may take a while.