Fig. 1.
Download original image
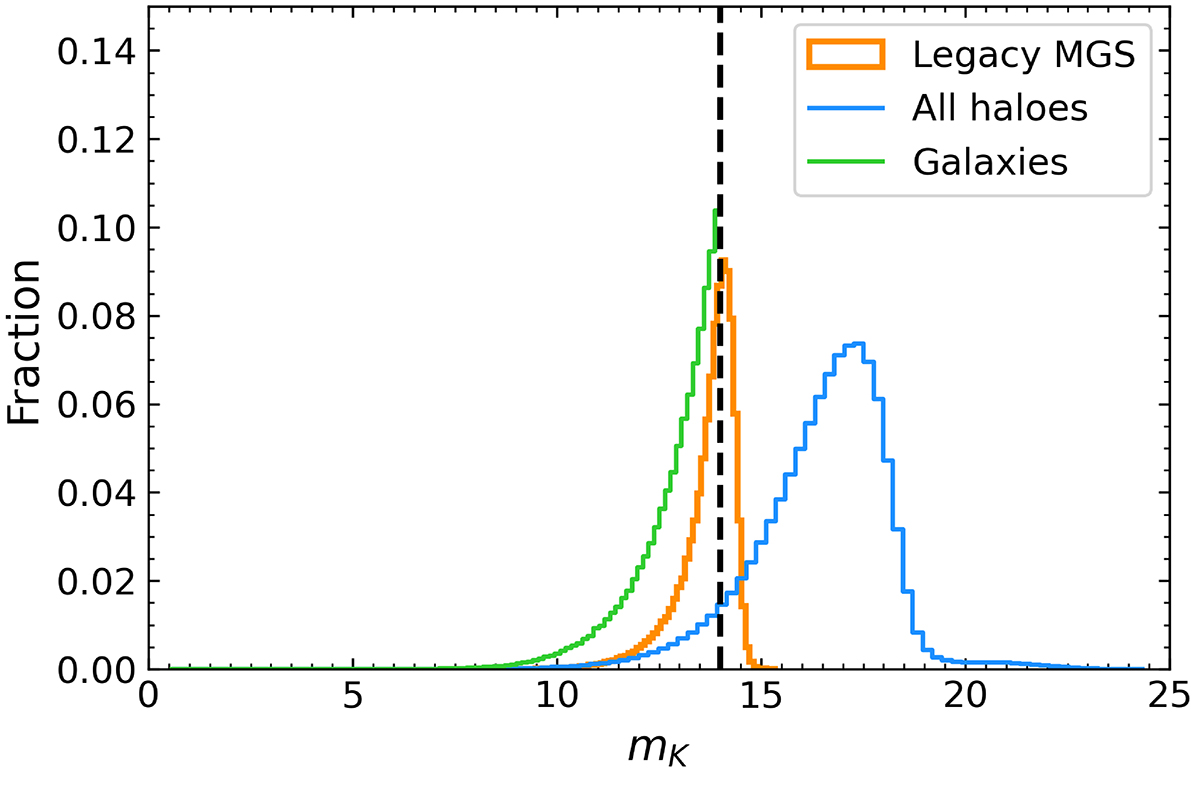
Apparent K-band magnitude distributions for the halos in our simulation and for SDSS galaxies. The orange line refers to the Legacy MGS galaxies with apparent K-band magnitude from the NYU-VAGC sample. The light blue line refers to the mK distribution for all halos in our simulation (with mK computed with Eq. (1)). The green line shows the distribution for our magnitude-selected simulated galaxy sample. The vertical black dashed line shows our magnitude threshold of mK = 14.
Current usage metrics show cumulative count of Article Views (full-text article views including HTML views, PDF and ePub downloads, according to the available data) and Abstracts Views on Vision4Press platform.
Data correspond to usage on the plateform after 2015. The current usage metrics is available 48-96 hours after online publication and is updated daily on week days.
Initial download of the metrics may take a while.