Fig. 6.
Download original image
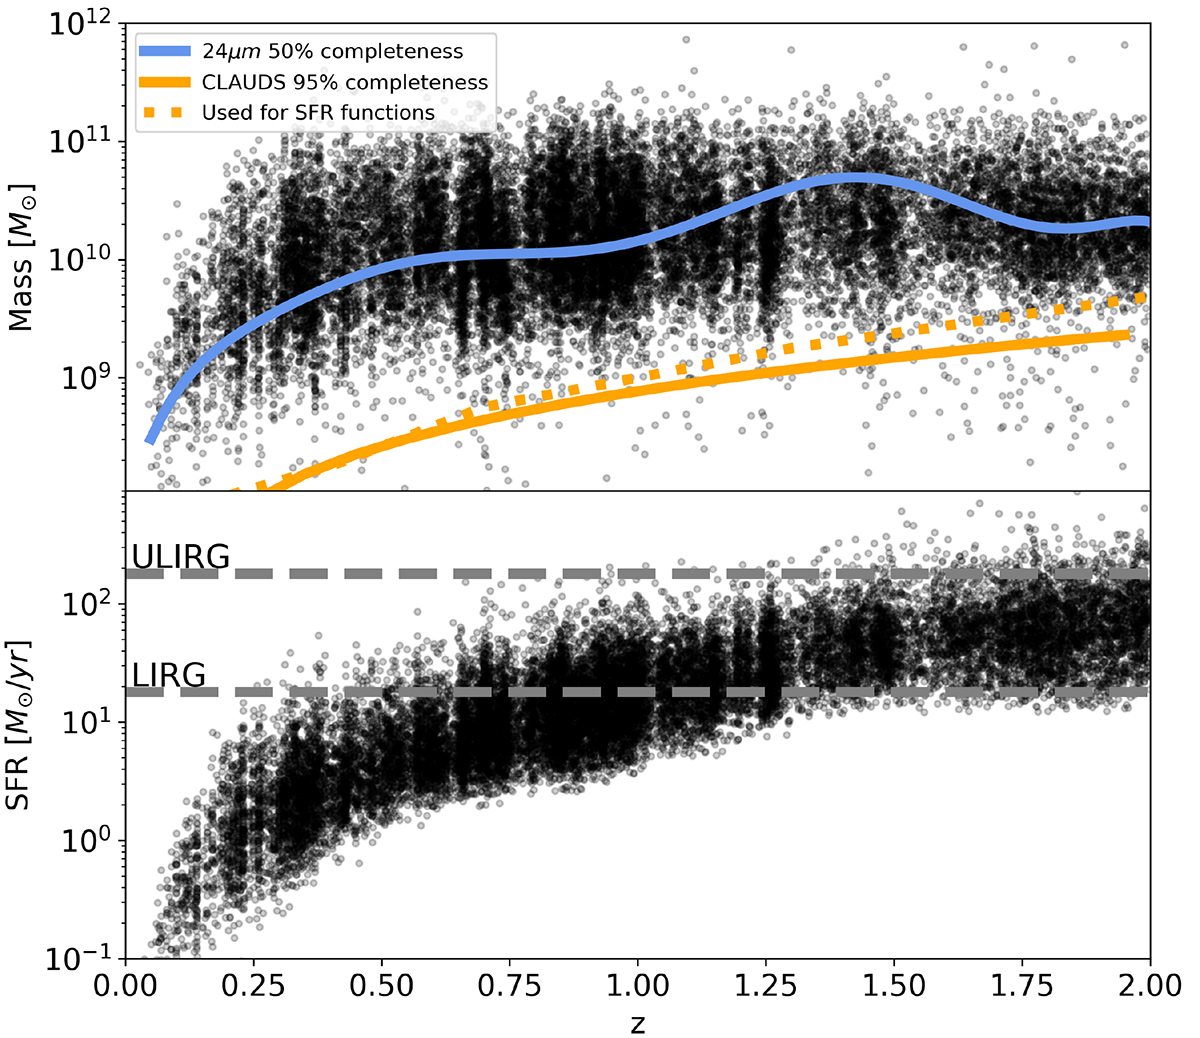
Stellar mass distributions (top panel) and SFR distributions (bottom panel) as a function of redshift for the 24 μm sample. The solid blue line represents the 50% mass completeness limit of the FIR sample (see text), while the orange line represents the stellar mass completeness of the HSC-CLAUDS K-selected sample (K ≤ 24.5; see text). The horizontal gray lines in the bottom panel indicate the SFR threshold that corresponds to the luminous (LIRG, LIR ≥ 1011 L⊙) and ultra-luminous (ULIRG, LIR ≥ 1012 L⊙) infrared galaxies.
Current usage metrics show cumulative count of Article Views (full-text article views including HTML views, PDF and ePub downloads, according to the available data) and Abstracts Views on Vision4Press platform.
Data correspond to usage on the plateform after 2015. The current usage metrics is available 48-96 hours after online publication and is updated daily on week days.
Initial download of the metrics may take a while.