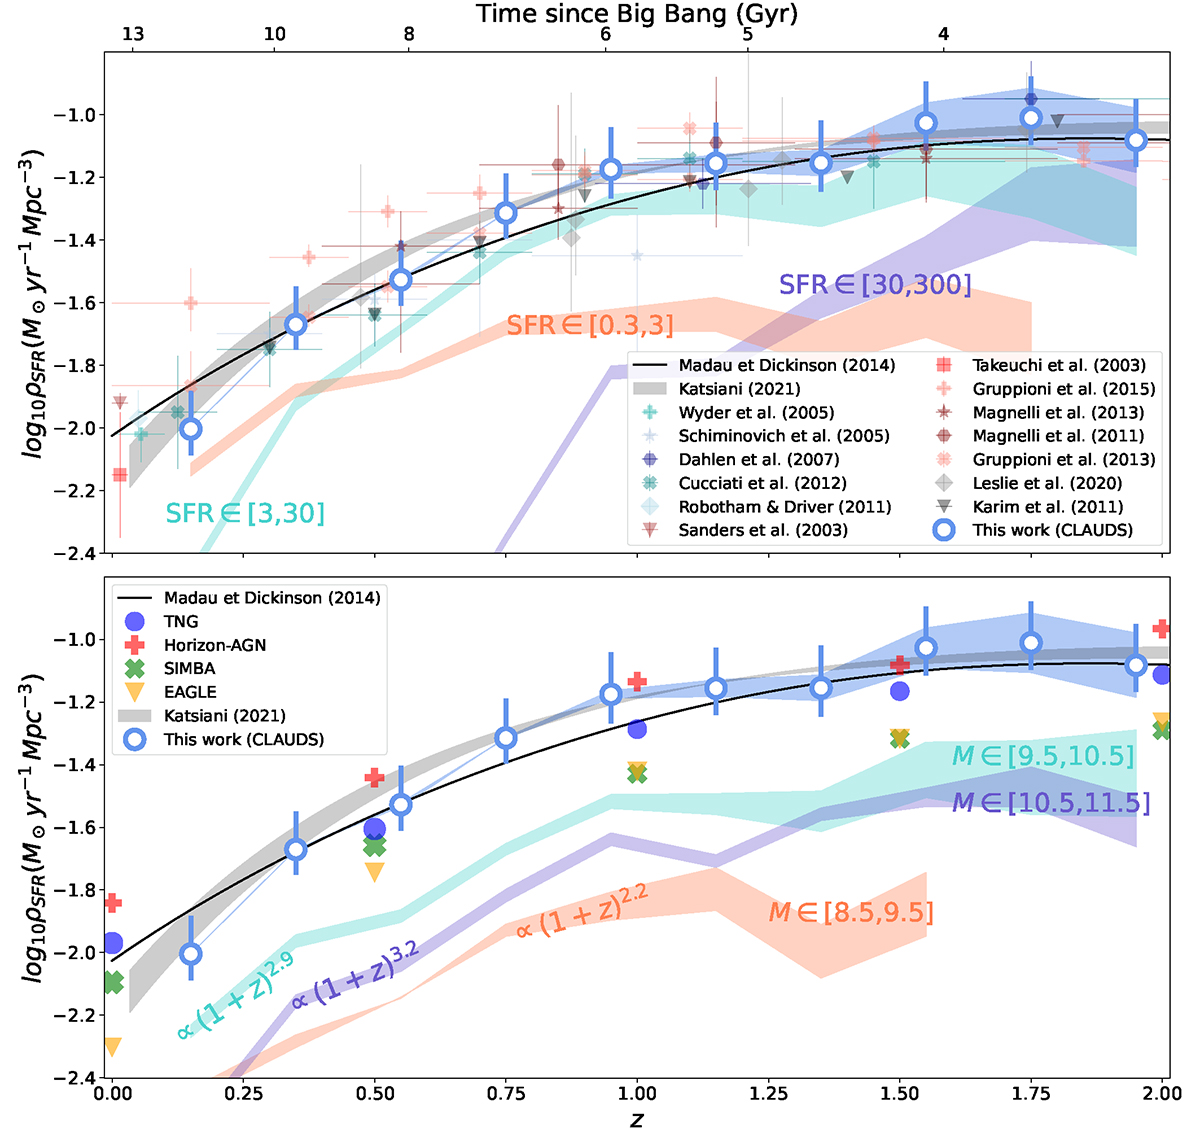
Fig. 17.
Download original image
Cosmic SFRD. The blue dots correspond to the averaged SFRD resulting from the two IRX calibrations, with the upper and lower limits of the blue-filled area corresponding to the calibration with and without stacking, respectively. The error bars on the blue dots are computed using the faint-end slope uncertainty of the SFR functions, α = −1.3 ± 0.1. In the top panel, SFRDs from other observational studies are added with colors depending on their estimator: UV (blueish), infrared (reddish), and radio (black). In the bottom panel, SFRDs measured from the four hydrodynamical simulations are added. In both subplots, we also add the contributions to the cosmic SFRD of different stellar-mass and SFR regimes (color-shaded areas).
Current usage metrics show cumulative count of Article Views (full-text article views including HTML views, PDF and ePub downloads, according to the available data) and Abstracts Views on Vision4Press platform.
Data correspond to usage on the plateform after 2015. The current usage metrics is available 48-96 hours after online publication and is updated daily on week days.
Initial download of the metrics may take a while.