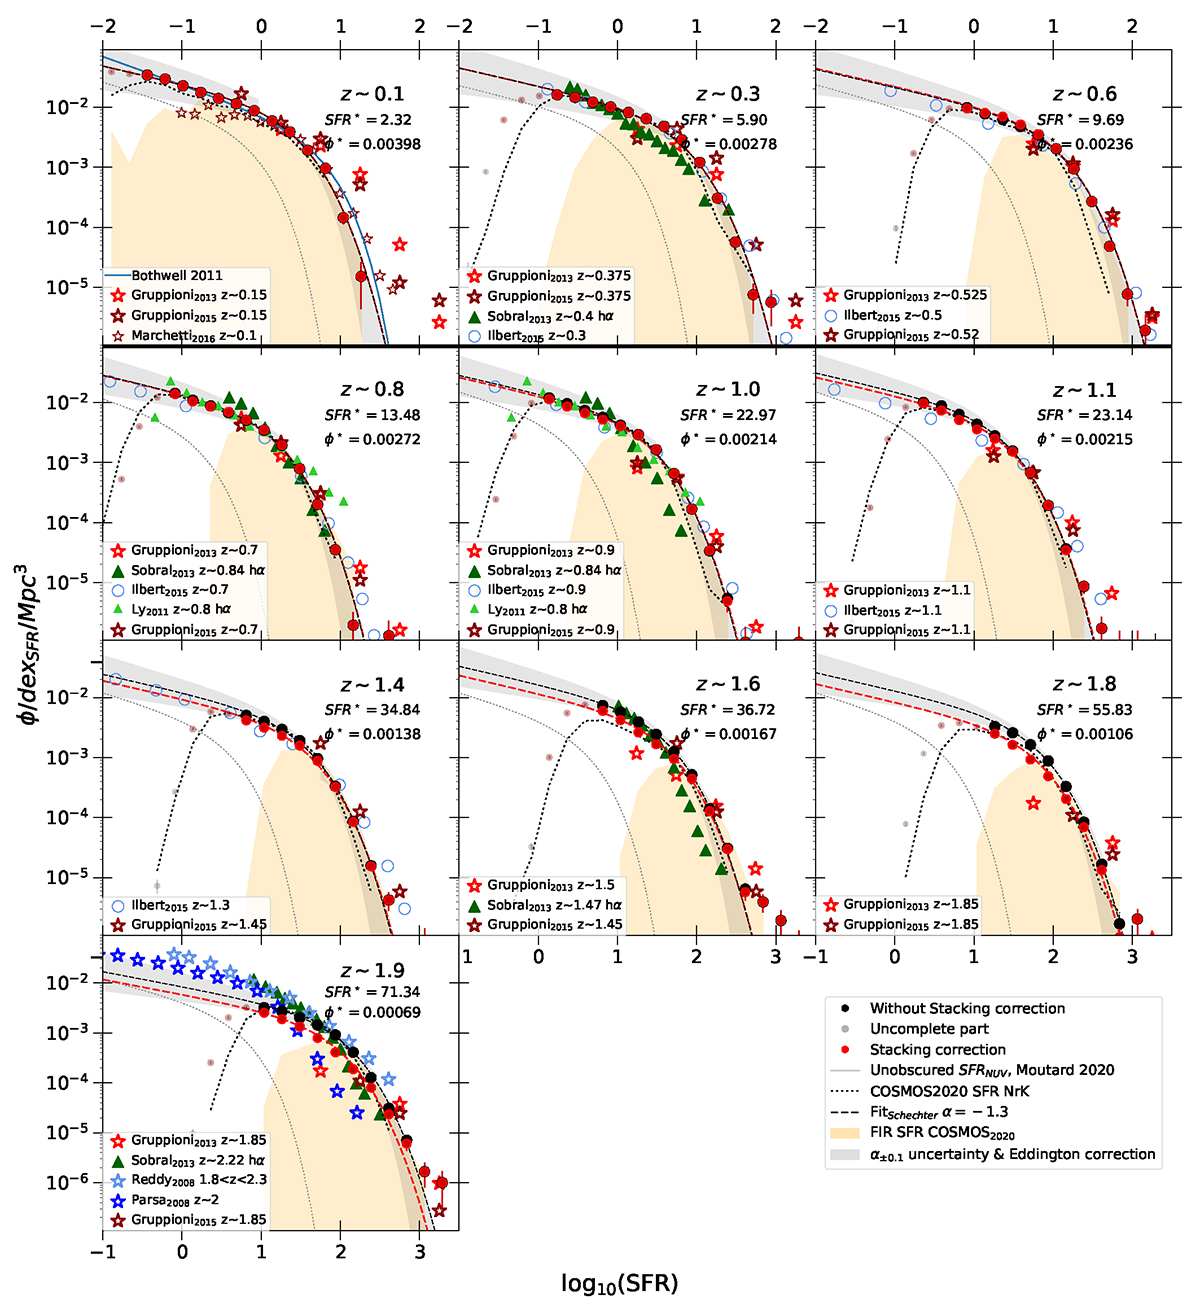
Fig. 14.
Download original image
SFR functions per redshift bin from z = 0.05 to z = 2.05. The black- and red-filled circles correspond to the HSC-CLAUDS data with and without the stacking correction. The short-dashed black and long-dashed red lines correspond to the best-fitted Schechter functions assuming a fixed slope parameter (α = −1.3). The gray area corresponds at the bright end to the Eddington correction and at the faint end to the slope uncertainty (Δα = 0.1). The orange areas represent the SFR functions based on the SFR derived from the COSMOS2020 FIR data set. In the top panels, the SFR range is translated by 1 dex to make the low-SFR regime of the SFRFs visible.
Current usage metrics show cumulative count of Article Views (full-text article views including HTML views, PDF and ePub downloads, according to the available data) and Abstracts Views on Vision4Press platform.
Data correspond to usage on the plateform after 2015. The current usage metrics is available 48-96 hours after online publication and is updated daily on week days.
Initial download of the metrics may take a while.