Open Access
Fig. 8.
Download original image
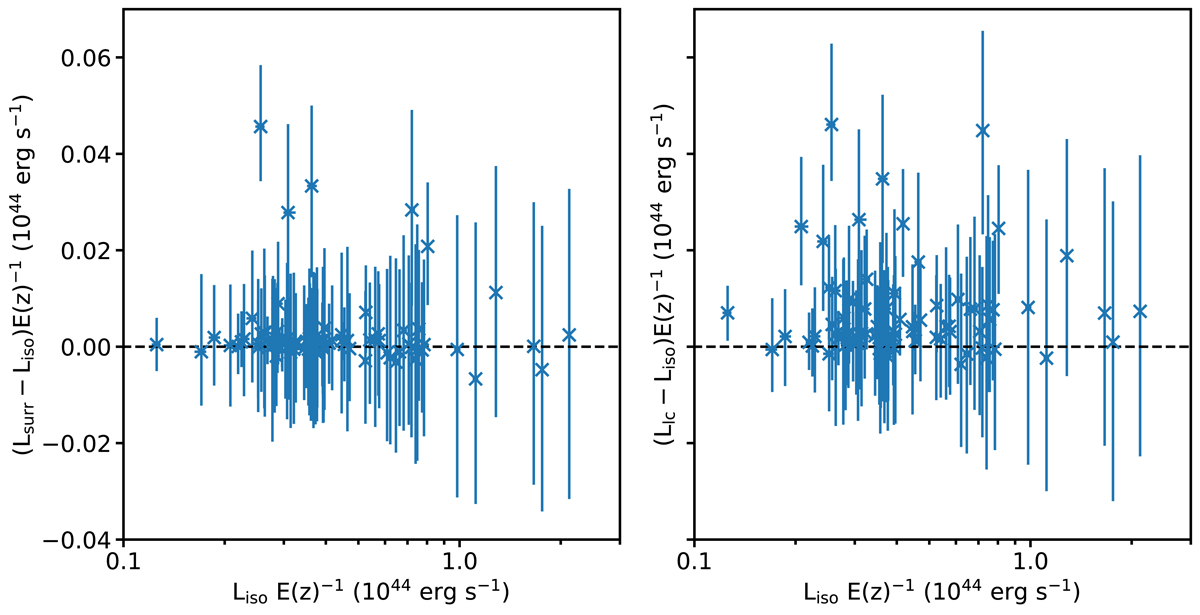
Comparisons between the fitted cluster luminosities of the isolated sample vs. the surroundings and lightcone samples, showing the difference of two samples plotted against the isolated sample (where the black dashed line indicates no difference).
Current usage metrics show cumulative count of Article Views (full-text article views including HTML views, PDF and ePub downloads, according to the available data) and Abstracts Views on Vision4Press platform.
Data correspond to usage on the plateform after 2015. The current usage metrics is available 48-96 hours after online publication and is updated daily on week days.
Initial download of the metrics may take a while.