Fig. 4.
Download original image
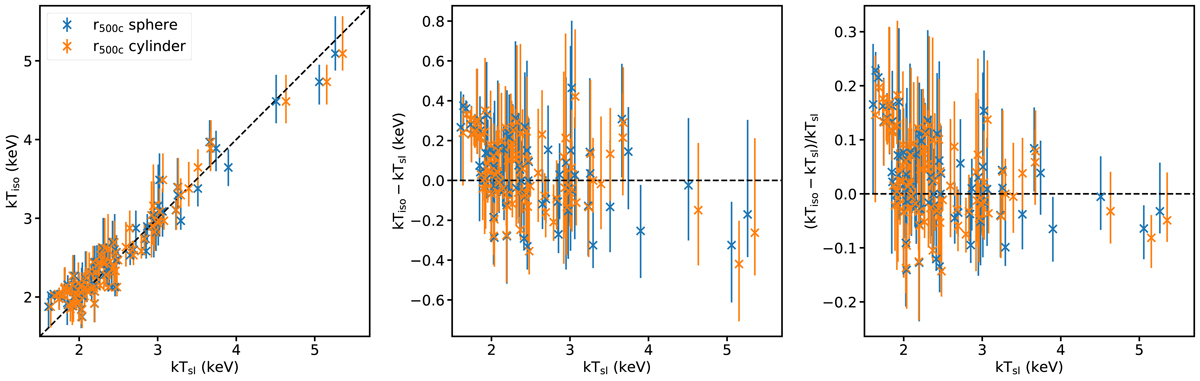
Spectroscopic-like temperatures computed from simulation (using Eq. (1)), using both the sphere and cylinder regions vs. fitted temperatures from the isolated sample. The center panel shows the differences between the two temperatures plotted against the spectroscopic-like temperatures, and the right panel shows the fractional difference against the spectroscopic-like temperatures. The black dashed lines indicate equality between the temperatures in each panel.
Current usage metrics show cumulative count of Article Views (full-text article views including HTML views, PDF and ePub downloads, according to the available data) and Abstracts Views on Vision4Press platform.
Data correspond to usage on the plateform after 2015. The current usage metrics is available 48-96 hours after online publication and is updated daily on week days.
Initial download of the metrics may take a while.