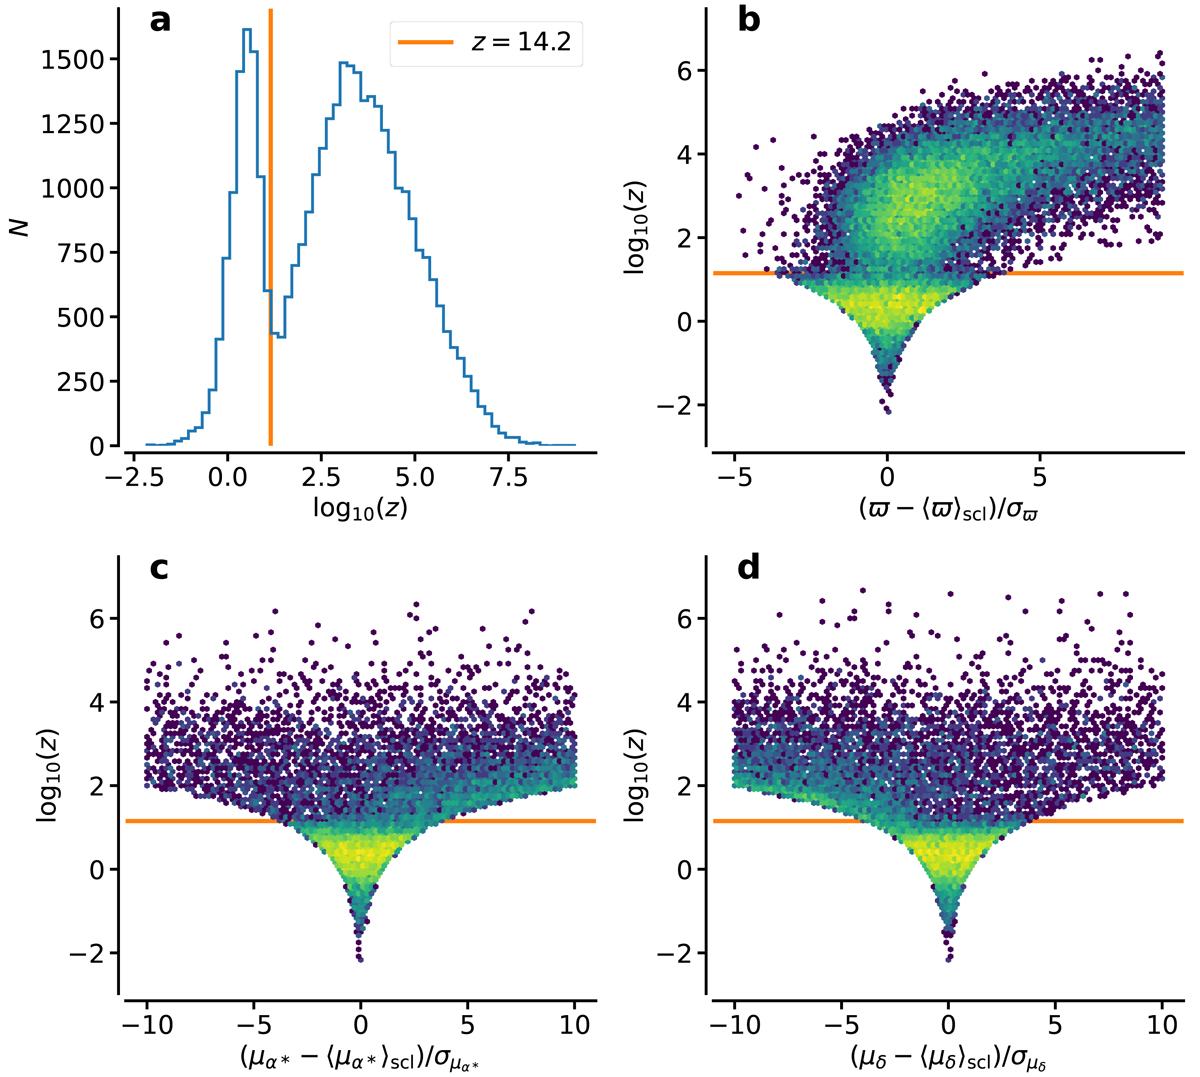
Fig. 9.
Download original image
Sculptor membership score, z. (a) Histogram of log10(z) for all sources in the Sculptor field, where Sculptor members are expected to have z < zlim = 14.2. The Distribution of log10(z) is shown as a function of: (b) (ϖ−⟨ϖ⟩scl)/σϖ; (c) (μα* − ⟨μα*⟩scl)/σμα*; and (d) (μδ − ⟨μδ⟩scl)/σμδ. The orange line always indicates zlim = 14.2, which is the equivalent of 3σ for a 1D normal distribution, or the 99.9% tile equivalent of the theoretical distribution of Sculptor members.
Current usage metrics show cumulative count of Article Views (full-text article views including HTML views, PDF and ePub downloads, according to the available data) and Abstracts Views on Vision4Press platform.
Data correspond to usage on the plateform after 2015. The current usage metrics is available 48-96 hours after online publication and is updated daily on week days.
Initial download of the metrics may take a while.