Fig. 7.
Download original image
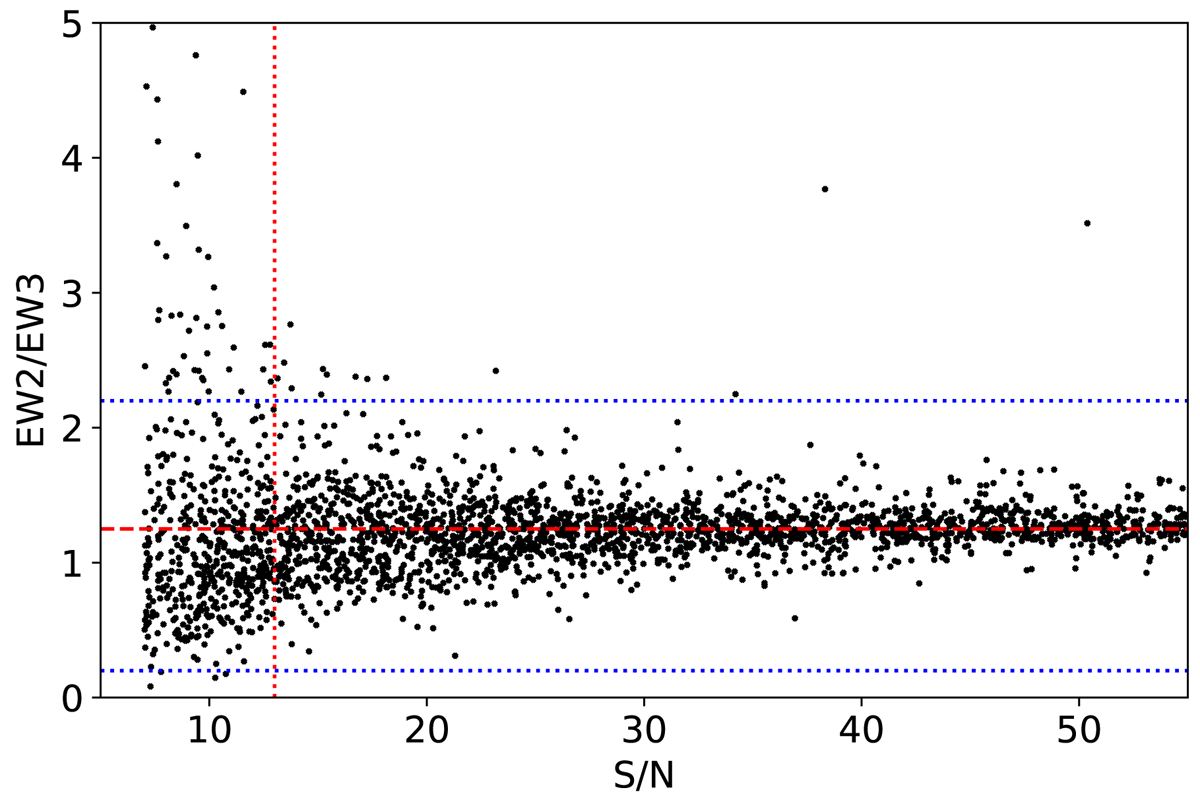
Ratios of the two strongest CaT lines (EW2/EW3) as a function of S/N. The vertical dotted red line is at S/N = 13, and dotted blue lines are limits of the reasonable values of the ratio at 0.2 < EW2/EW3 < 2.2. Outside this range there is most likely a problem with a poorly subtracted sky line interfering with the measurement of EW2 and/or EW3.
Current usage metrics show cumulative count of Article Views (full-text article views including HTML views, PDF and ePub downloads, according to the available data) and Abstracts Views on Vision4Press platform.
Data correspond to usage on the plateform after 2015. The current usage metrics is available 48-96 hours after online publication and is updated daily on week days.
Initial download of the metrics may take a while.