Open Access
Fig. 3.
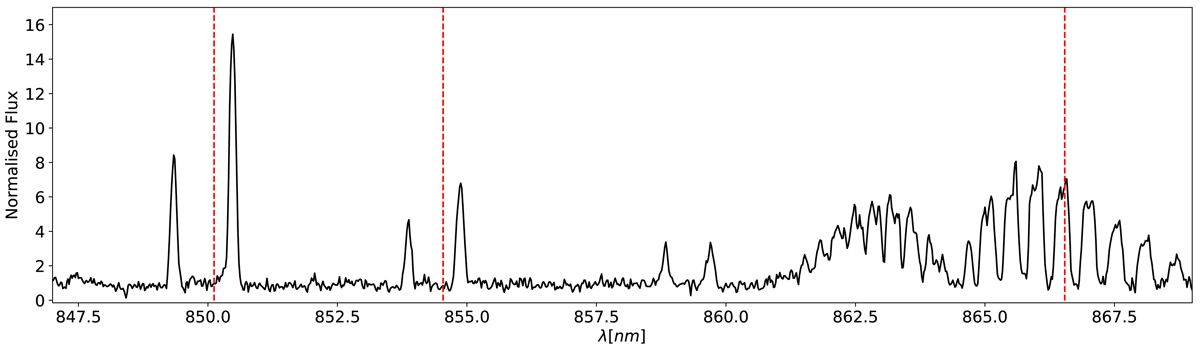
Download original image
Normalised sky spectrum from a single sky fibre, from the same observation and with the same normalisation as the top three spectra in Fig. 2. The central positions of the three CaT absorption lines at the mean velocity of the Sculptor dSph are marked as dashed red lines.
Current usage metrics show cumulative count of Article Views (full-text article views including HTML views, PDF and ePub downloads, according to the available data) and Abstracts Views on Vision4Press platform.
Data correspond to usage on the plateform after 2015. The current usage metrics is available 48-96 hours after online publication and is updated daily on week days.
Initial download of the metrics may take a while.