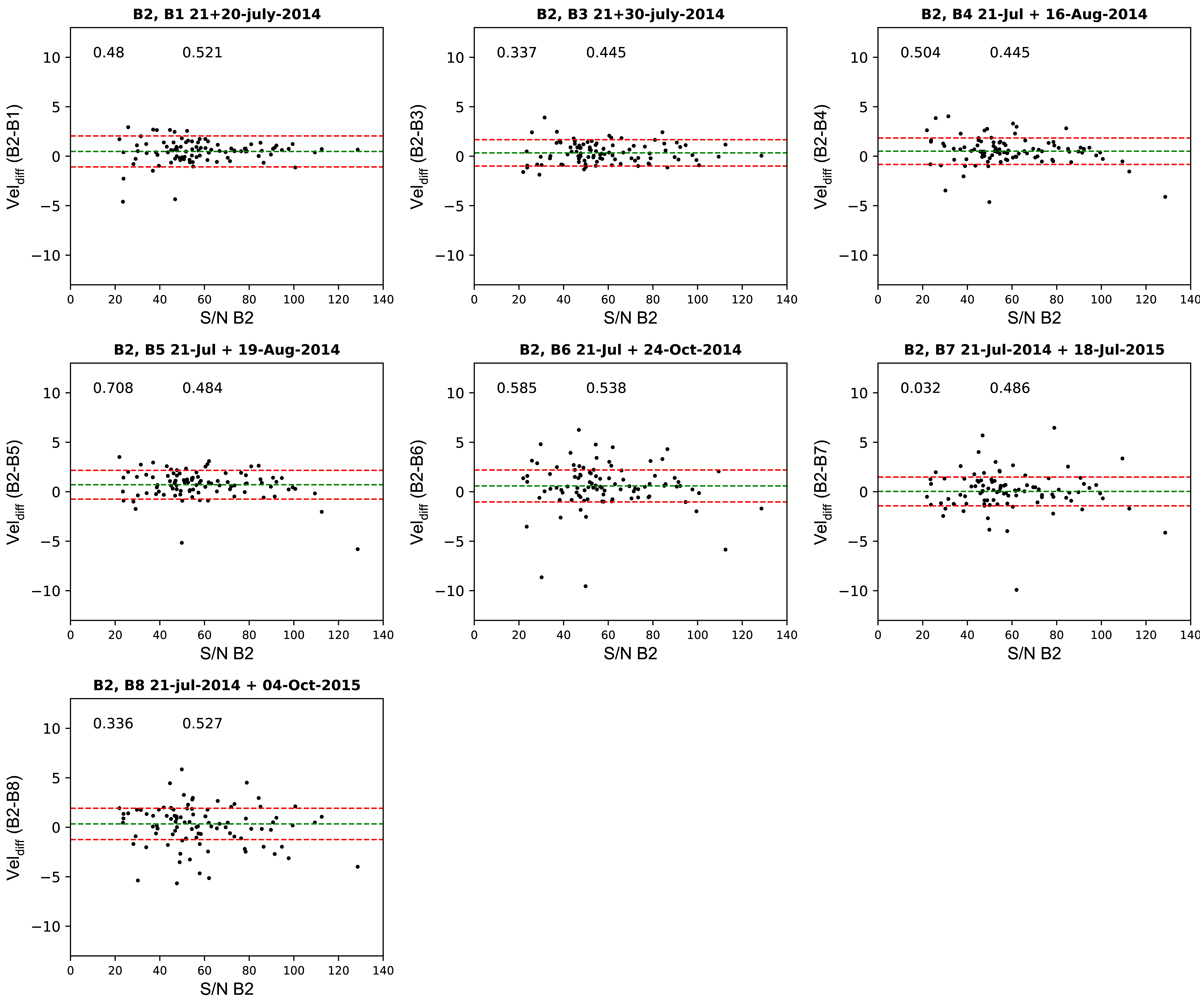
Fig. B.2.
Download original image
Comparison between the velocities measured for eight VLT/FLAMES LR8 observations of the same field and the same targets as a function of the S/N of the measurement. The observations were made between July 2014 and October 2015. All velocity measurements were compared with those from observation B2, which occurred on 21 July 2014. In the top of each plot the mean velocity offset and the variance for each comparison is given; the dashed green line is the mean, and the two dashed red lines on either side show 3σ about this mean.
Current usage metrics show cumulative count of Article Views (full-text article views including HTML views, PDF and ePub downloads, according to the available data) and Abstracts Views on Vision4Press platform.
Data correspond to usage on the plateform after 2015. The current usage metrics is available 48-96 hours after online publication and is updated daily on week days.
Initial download of the metrics may take a while.