Fig. 8.
Download original image
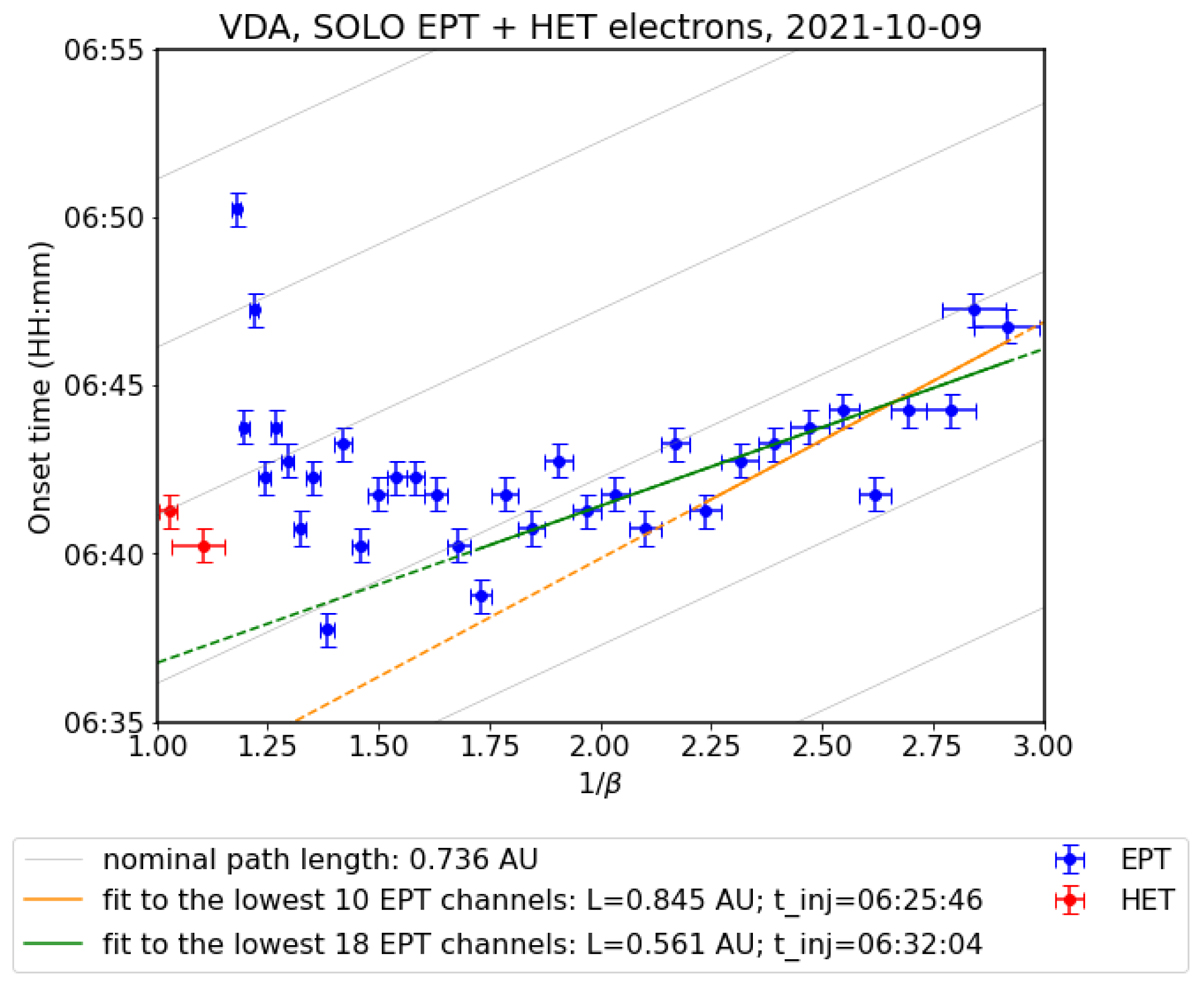
VDA based on onset times of Solar Orbiter EPT and HET electron channels. The horizontal axis shows the inverse of the average unit-less speed of electrons as observed in each channel. The vertical axis presents the determined onset time for each energy channel. Onset times observed by EPT (HET) are marked in blue (red). Horizontal error bars represent the width of the energy channels, and vertical error bars represent the time resolution used to determine the onsets (30 s). The orange and green lines are linear fits to the lowest 10 and 18 energy channels of EPT, respectively. The grey lines represent the slope corresponding to a path length matching the nominal Parker spiral length at Solar Orbiter’s radial distance.
Current usage metrics show cumulative count of Article Views (full-text article views including HTML views, PDF and ePub downloads, according to the available data) and Abstracts Views on Vision4Press platform.
Data correspond to usage on the plateform after 2015. The current usage metrics is available 48-96 hours after online publication and is updated daily on week days.
Initial download of the metrics may take a while.