Fig. 5.
Download original image
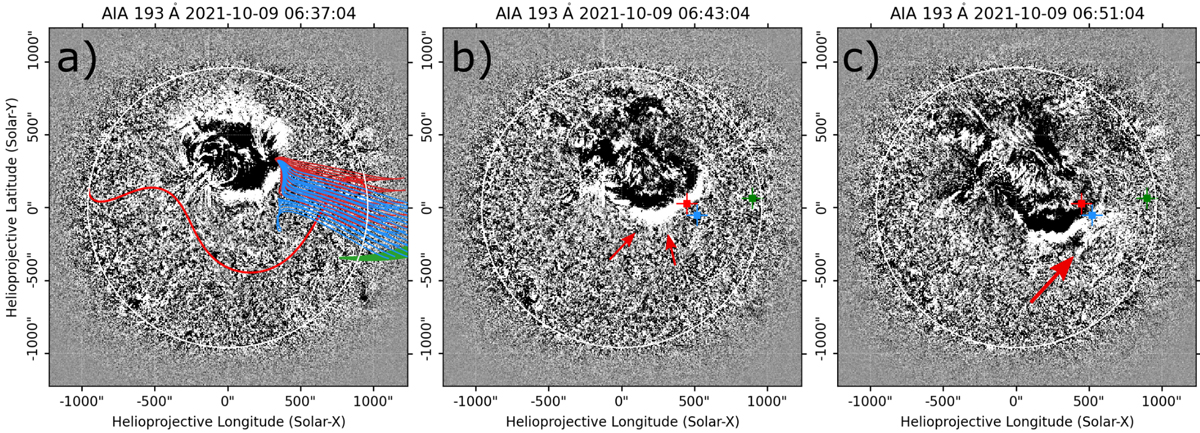
Evolution of the EUV wave as observed by SDO/AIA 193 Å at three time instances. Panel (a) shows the EUV wave close to the SXR peak time. The open magnetic field lines connecting to Solar Orbiter, STEREO-A, and Wind are drawn in blue, red, and green, respectively. The red line across the Sun face represents the heliospheric current sheet. Panels (b) and (c) show the EUV wave expansion at 06:43 UT and 06:51 UT, roughly corresponding to TII(HB) and TII(W). The red arrows indicate the region of interest where the wave also undergoes reflection at the coronal hole boundary. The blue, red, and green markings in panels (b) and (c) represent the spacecraft connections shown in (a).
Current usage metrics show cumulative count of Article Views (full-text article views including HTML views, PDF and ePub downloads, according to the available data) and Abstracts Views on Vision4Press platform.
Data correspond to usage on the plateform after 2015. The current usage metrics is available 48-96 hours after online publication and is updated daily on week days.
Initial download of the metrics may take a while.