Fig. 3.
Download original image
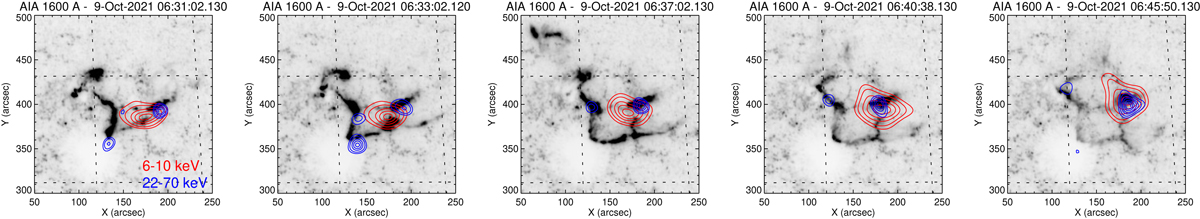
Flare evolution as seen in a series of SDO/AIA 1600 Å images. Due to the inverted colour table, the flare ribbons and kernels are dark. The AIA frames have been rotated to conform to the view from Solar Orbiter. The provided times represent the recording times of the AIA frames (UT at Earth). STIX images showing the thermal and non-thermal X-ray sources are overlaid as red and blue contours, respectively.
Current usage metrics show cumulative count of Article Views (full-text article views including HTML views, PDF and ePub downloads, according to the available data) and Abstracts Views on Vision4Press platform.
Data correspond to usage on the plateform after 2015. The current usage metrics is available 48-96 hours after online publication and is updated daily on week days.
Initial download of the metrics may take a while.