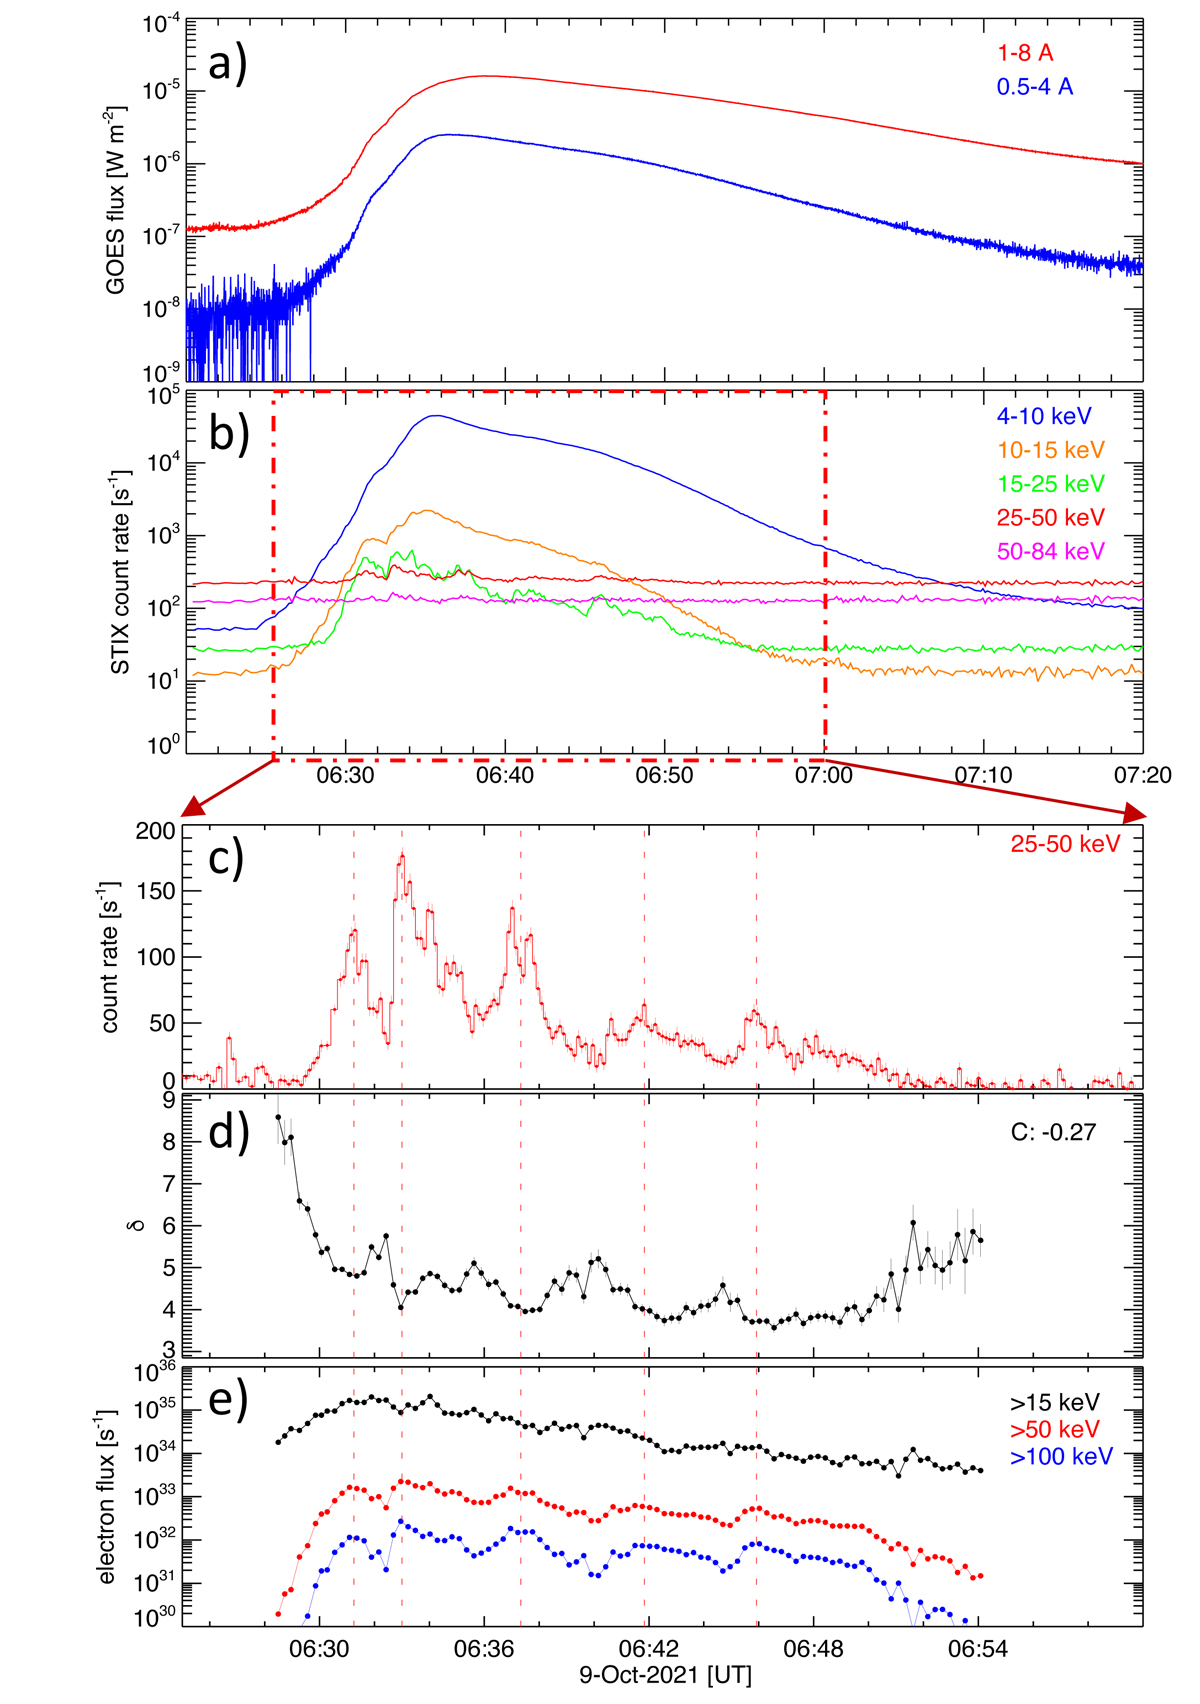
Fig. 2.

Download original image
Combined GOES-STIX analysis. (a) GOES SXR fluxes showing the thermal emission of the M1.6 flare. (b) STIX HXR count rates in five broad energy bands. The STIX times have been shifted to be consistent with the GOES observations from 1 AU. Results of the spectral fitting of STIX spectra show: (c) the background-subtracted STIX count rate in the 25–50 keV range, (d) the spectral index of the injected electrons (δC shows the correlation coefficient with the count rate), and (e) the injected electron flux above 15, 50, and 100 keV. The five major non-thermal peaks are indicated by dashed red lines.
Current usage metrics show cumulative count of Article Views (full-text article views including HTML views, PDF and ePub downloads, according to the available data) and Abstracts Views on Vision4Press platform.
Data correspond to usage on the plateform after 2015. The current usage metrics is available 48-96 hours after online publication and is updated daily on week days.
Initial download of the metrics may take a while.


