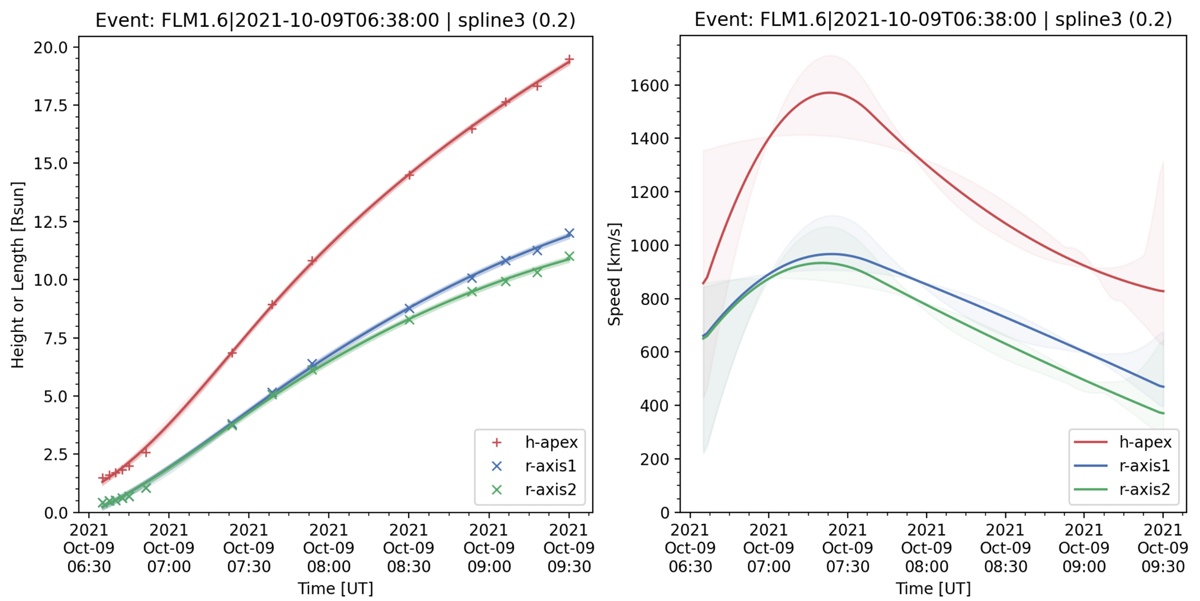
Fig. C.1.
Download original image
Kinematics of the reconstructed shock wave. The three axes of an ellipsoidal fit, namely, the shock apex (red) and the two flank axes (r-axis 1 in blue and r-axis 2 in green), are plotted together and represented with different colours. The left and right panels show the height-time evolution of all three shock axes and its first derivative (velocity), respectively. The possible errors are in each axis and indicated by the shaded regions. The ‘+’ and ‘x’ markings on the curves are the constraints provided by the observations.
Current usage metrics show cumulative count of Article Views (full-text article views including HTML views, PDF and ePub downloads, according to the available data) and Abstracts Views on Vision4Press platform.
Data correspond to usage on the plateform after 2015. The current usage metrics is available 48-96 hours after online publication and is updated daily on week days.
Initial download of the metrics may take a while.