Fig. 9.
Download original image
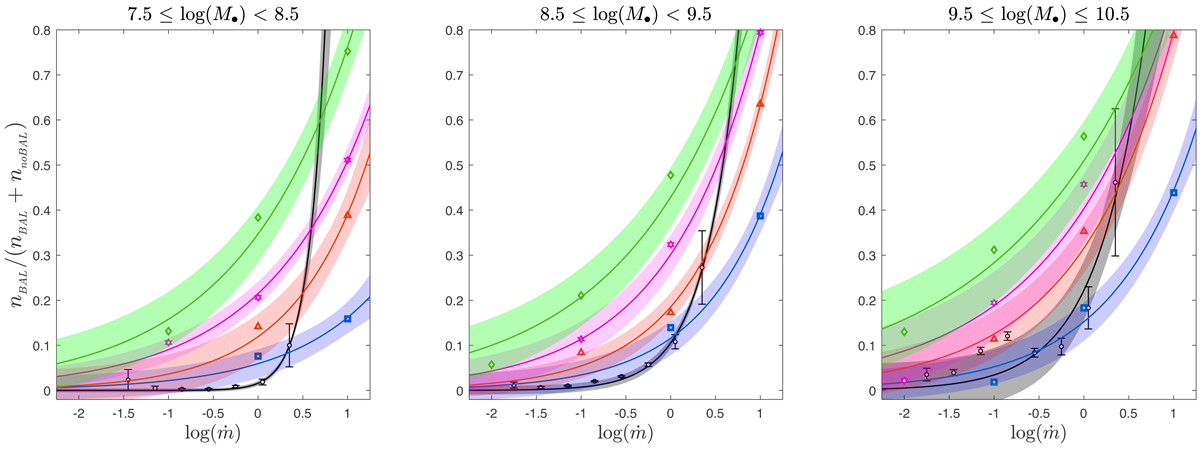
Distributions of the observational prevalence ratio r = nBAL/nTotal as a function of the Eddington ratio for three M• ranges, shown by solid black lines, compared to simulation data for the case without a torus. The metallicities of 1, 2.5, 5, and 10 are depicted in blue, red, magenta, and green, respectively. The solid lines in each case show the best exponential fit to the corresponding data.
Current usage metrics show cumulative count of Article Views (full-text article views including HTML views, PDF and ePub downloads, according to the available data) and Abstracts Views on Vision4Press platform.
Data correspond to usage on the plateform after 2015. The current usage metrics is available 48-96 hours after online publication and is updated daily on week days.
Initial download of the metrics may take a while.