Fig. A.1.
Download original image
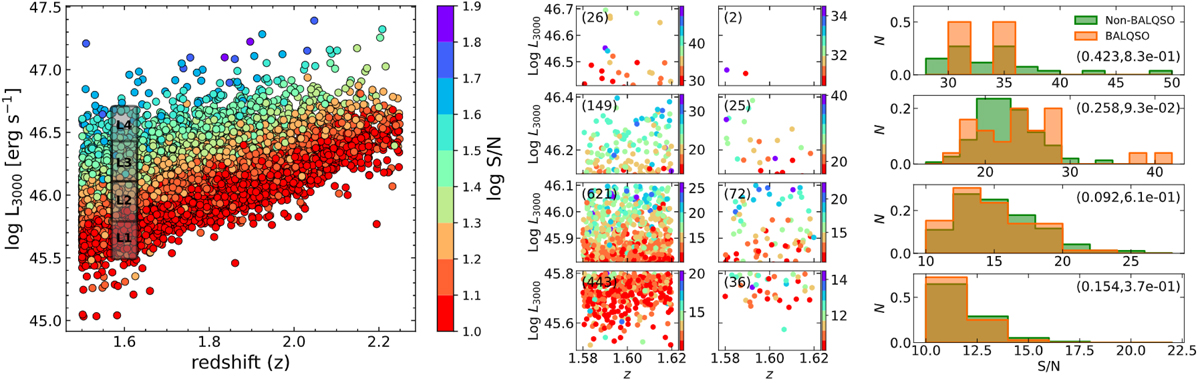
Bias analysis of the sample. Left panel: Relation between the luminosity at 3000Å and redshift. The grey patch indicates the redshift bin we used to test the effect of the S/N (see Appendix A). The colour code marks the S/N value in the log scale. Middle panel: Behavior of the S/N in each luminosity bin. The colour scale describes the S/N, and the number in parentheses corresponds to the number of sources in each bin. Right panel: Distribution of the S/N in each luminosity bin. The numbers in parentheses indicate the results from a two-sample KS test.
Current usage metrics show cumulative count of Article Views (full-text article views including HTML views, PDF and ePub downloads, according to the available data) and Abstracts Views on Vision4Press platform.
Data correspond to usage on the plateform after 2015. The current usage metrics is available 48-96 hours after online publication and is updated daily on week days.
Initial download of the metrics may take a while.