Fig. 10.
Download original image
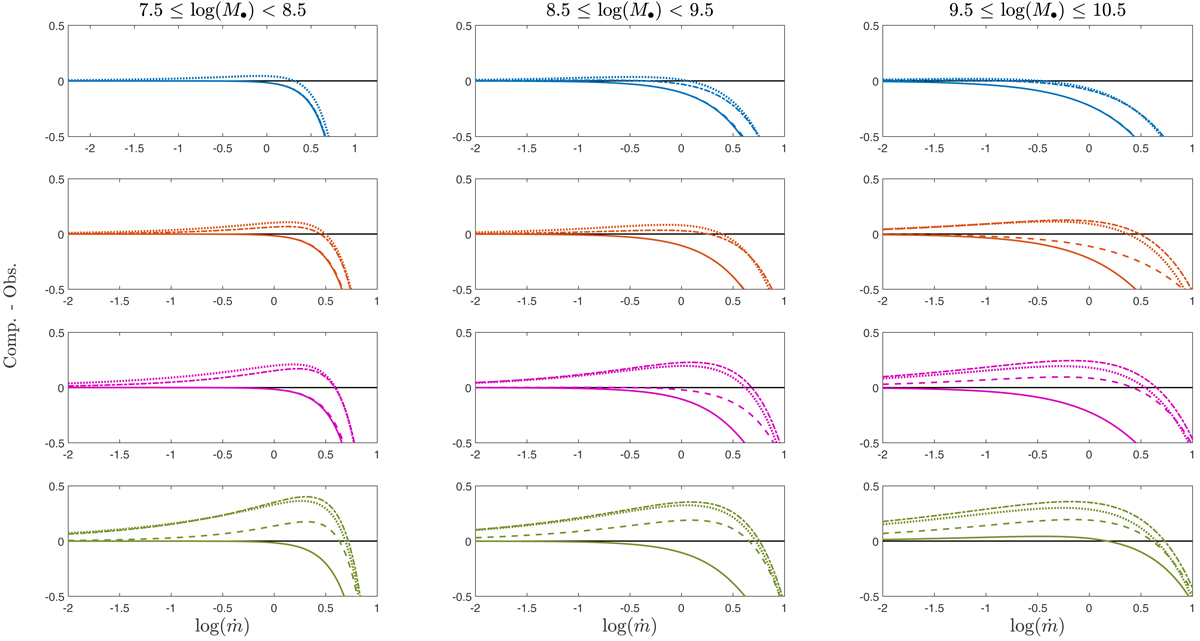
Residual of the computational results of the probability of observing BALs (simulations) subtracted from the prevalence ratio (observational data). The four adopted values of the metallicities of 1, 2.5, 5, and 10 are represented in blue, red, magenta, and green. The solid black line is depicted as a reference for the observational data. The solid, dashed, dash-dotted, and dotted lines correspond to opening angles of the torus of 45, 60, 75, and 90 (no torus), respectively. The results are presented as a function of Eddington ratio (in steps of 0.3 dex) for three M• ranges.
Current usage metrics show cumulative count of Article Views (full-text article views including HTML views, PDF and ePub downloads, according to the available data) and Abstracts Views on Vision4Press platform.
Data correspond to usage on the plateform after 2015. The current usage metrics is available 48-96 hours after online publication and is updated daily on week days.
Initial download of the metrics may take a while.