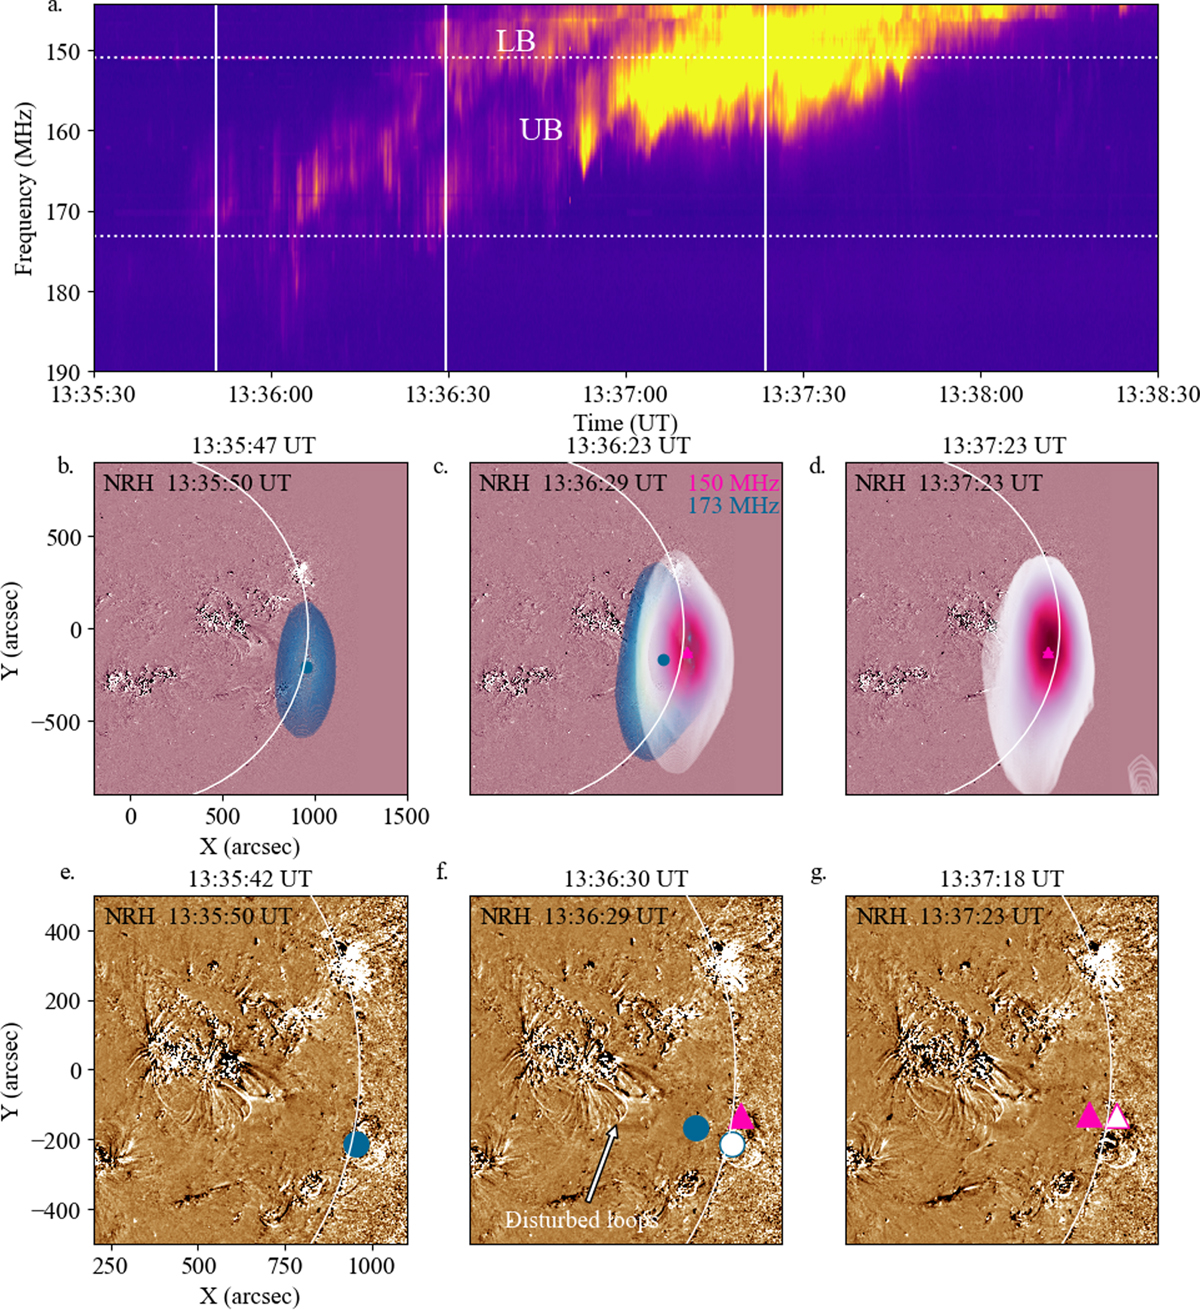
Fig. 2.
Download original image
Locations of the split bands of the type II radio burst harmonic lane. (a) Zoomed-in dynamic spectrum showing the harmonic emission of the type II burst observed by ORFEES. The band-splitting is labelled as follows: lower frequency band (LB) and upper frequency band (UB). (b-d) AIA 211 Å running difference images at three separate times showing the locations of the LB and UB bands at 150 (white to magenta filled contours) and 173 MHz (blue to green filled contours) corresponding to the vertical solid lines in (a). (e-g) AIA 211 Å running difference images at three separate times overlaid with the centroids of the LB and UB bands of the corresponding radio sources in (b). The centroids are shown as a magenta triangle at 150 MHz and a blue circle at 173 MHz. The running difference images are two minutes apart. The white symbols in panel f represents the location of the UB at an earlier time in (e), while the white symbol in panel g represents the centroid of the LB at an earlier time in (f).
Current usage metrics show cumulative count of Article Views (full-text article views including HTML views, PDF and ePub downloads, according to the available data) and Abstracts Views on Vision4Press platform.
Data correspond to usage on the plateform after 2015. The current usage metrics is available 48-96 hours after online publication and is updated daily on week days.
Initial download of the metrics may take a while.