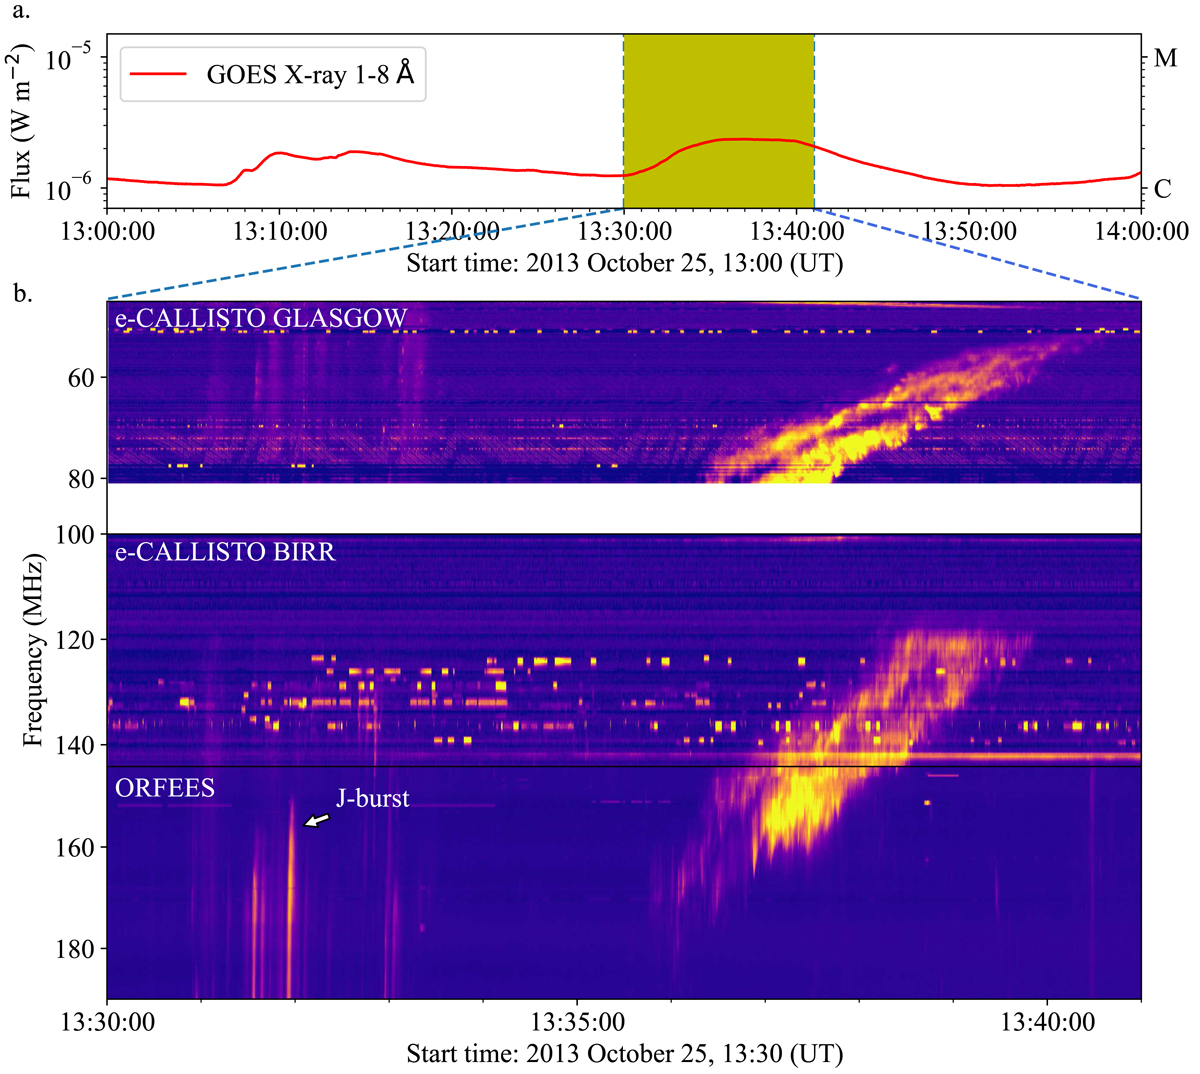
Fig. 1.
Download original image
Flare X-ray time series together with a dynamic spectrum of a type II radio burst. (a) GOES X-Ray light curve in the 1−8 Å channel. A C-class flare associated with the type II burst is shown inside the yellow region. (b) Combined dynamic spectrum from e-CALLISTO Glasgow (40−80 MHz), e-CALLISTO Birr (100−145 MHz), and ORFEES (145−200 MHz) during the time period of the yellow shaded region in a. The dynamic spectrum shows type III radio bursts followed by a type II burst with fundamental and harmonic lanes of emission.
Current usage metrics show cumulative count of Article Views (full-text article views including HTML views, PDF and ePub downloads, according to the available data) and Abstracts Views on Vision4Press platform.
Data correspond to usage on the plateform after 2015. The current usage metrics is available 48-96 hours after online publication and is updated daily on week days.
Initial download of the metrics may take a while.