Open Access
Fig. 8.
Download original image
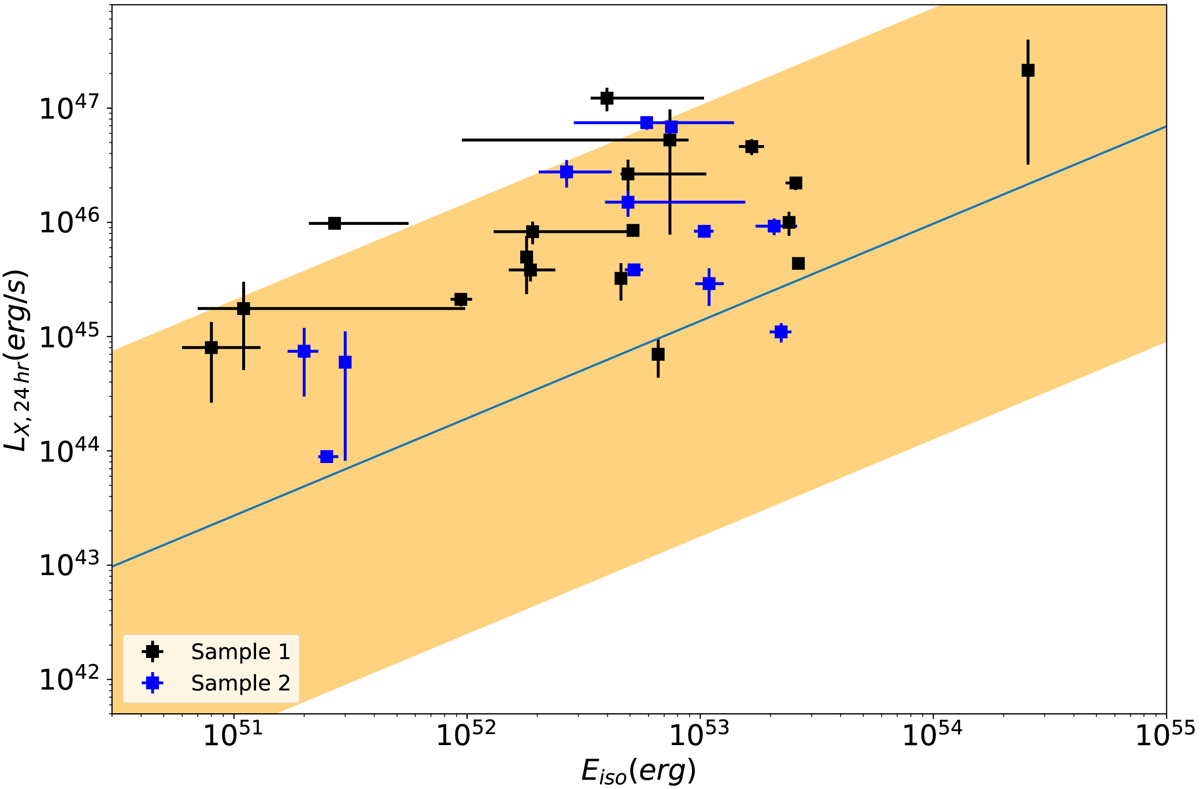
Comparison between the isotropic equivalent energy Eiso and the X-ray luminosity at 24 h after the trigger. The blue solid line and the yellow band represent the best fit and 3σ dispersion, respectively, of the same relation reported by D’Avanzo et al. (2012) for a complete sample of GRBs observed by Swift.
Current usage metrics show cumulative count of Article Views (full-text article views including HTML views, PDF and ePub downloads, according to the available data) and Abstracts Views on Vision4Press platform.
Data correspond to usage on the plateform after 2015. The current usage metrics is available 48-96 hours after online publication and is updated daily on week days.
Initial download of the metrics may take a while.