Open Access
Fig. 7.
Download original image
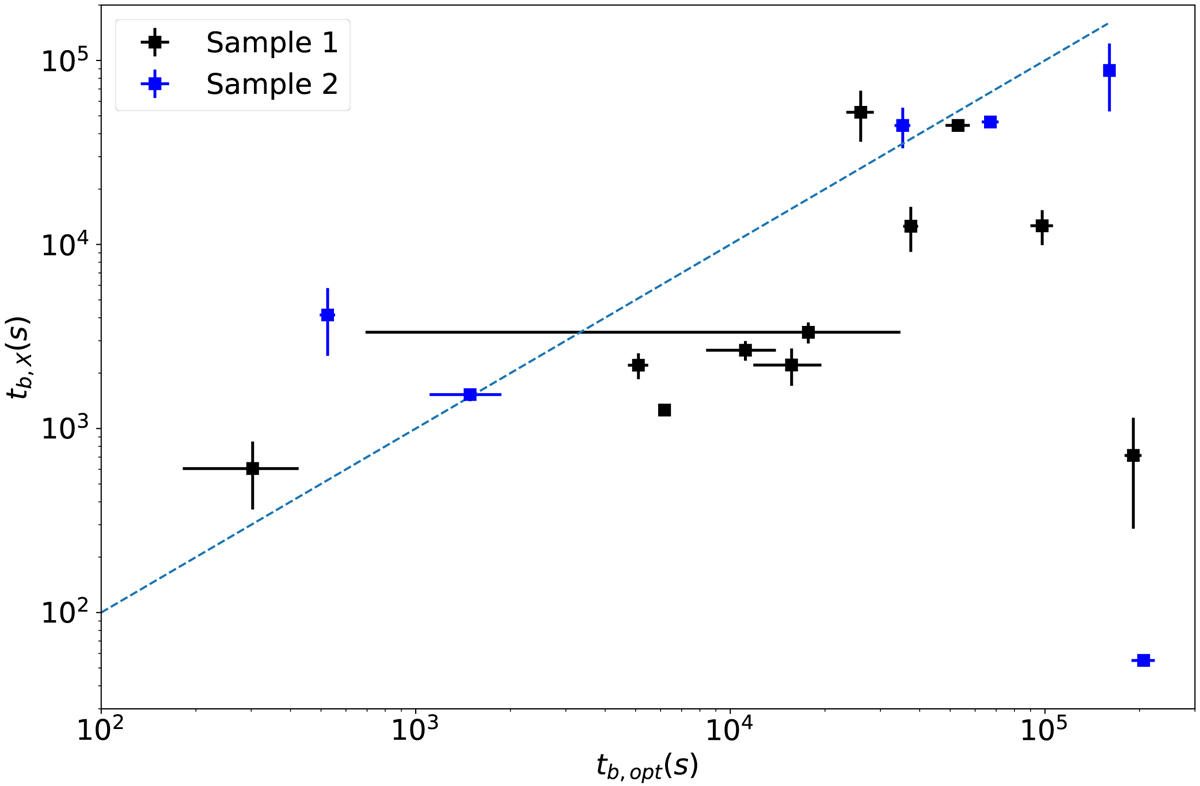
Relation between the duration of the X-ray and optical plateau. We indicate Sample 1 and Sample 2 with black and blue points, respectively. Time is reported in the rest frame of the source. The blue dashed line corresponds to tb,opt = tb,X.
Current usage metrics show cumulative count of Article Views (full-text article views including HTML views, PDF and ePub downloads, according to the available data) and Abstracts Views on Vision4Press platform.
Data correspond to usage on the plateform after 2015. The current usage metrics is available 48-96 hours after online publication and is updated daily on week days.
Initial download of the metrics may take a while.