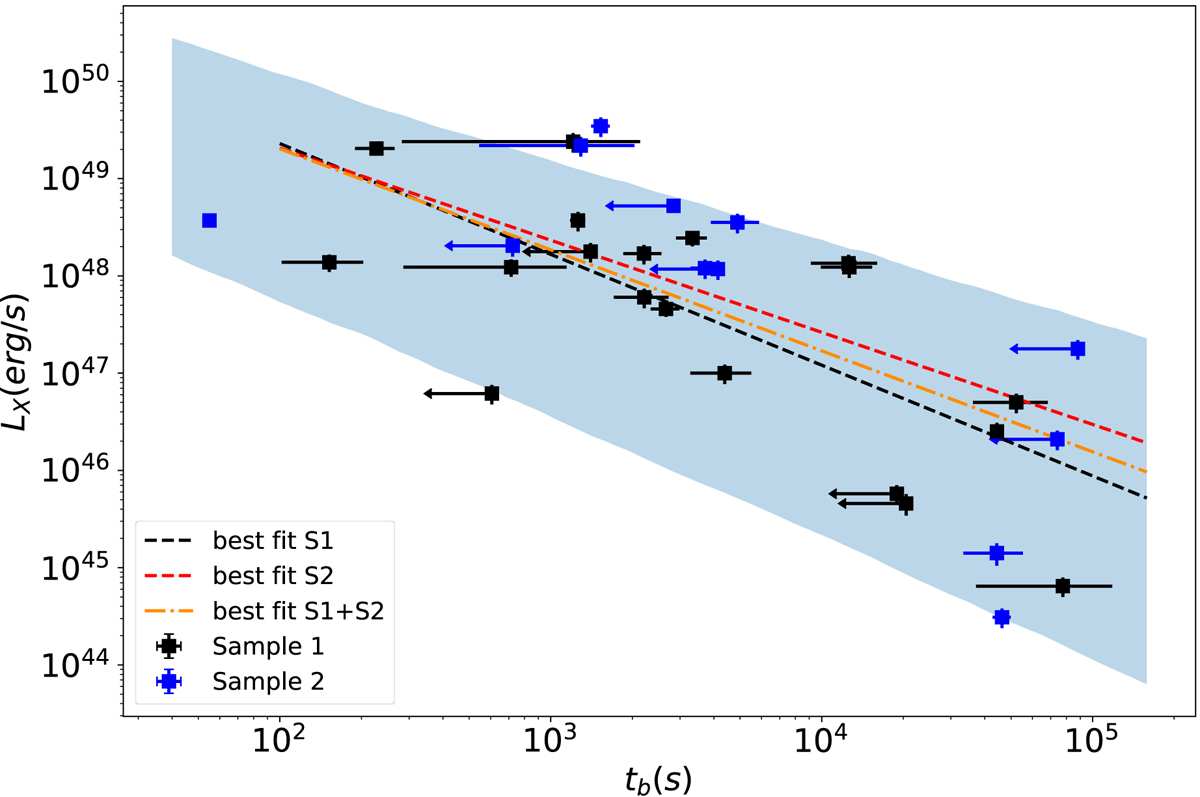
Fig. 4.
Download original image
Relation between the X-ray luminosity and duration of the plateau. We indicate Sample 1 and Sample 2 with black and blue points, respectively. Arrows show upper limits. Time is reported in the rest frame of the source. The black (red) dashed line is the best-fit line for Sample 1 (Sample 2) where the fitting function is log10(LX) = N + λlog10(tb). The orange dot-dashed line is the corresponding best fit for the union of Sample 1 and Sample 2. The light blue band indicates the 1σ region defined by the best-fit values found by Dainotti et al. (2010).
Current usage metrics show cumulative count of Article Views (full-text article views including HTML views, PDF and ePub downloads, according to the available data) and Abstracts Views on Vision4Press platform.
Data correspond to usage on the plateform after 2015. The current usage metrics is available 48-96 hours after online publication and is updated daily on week days.
Initial download of the metrics may take a while.