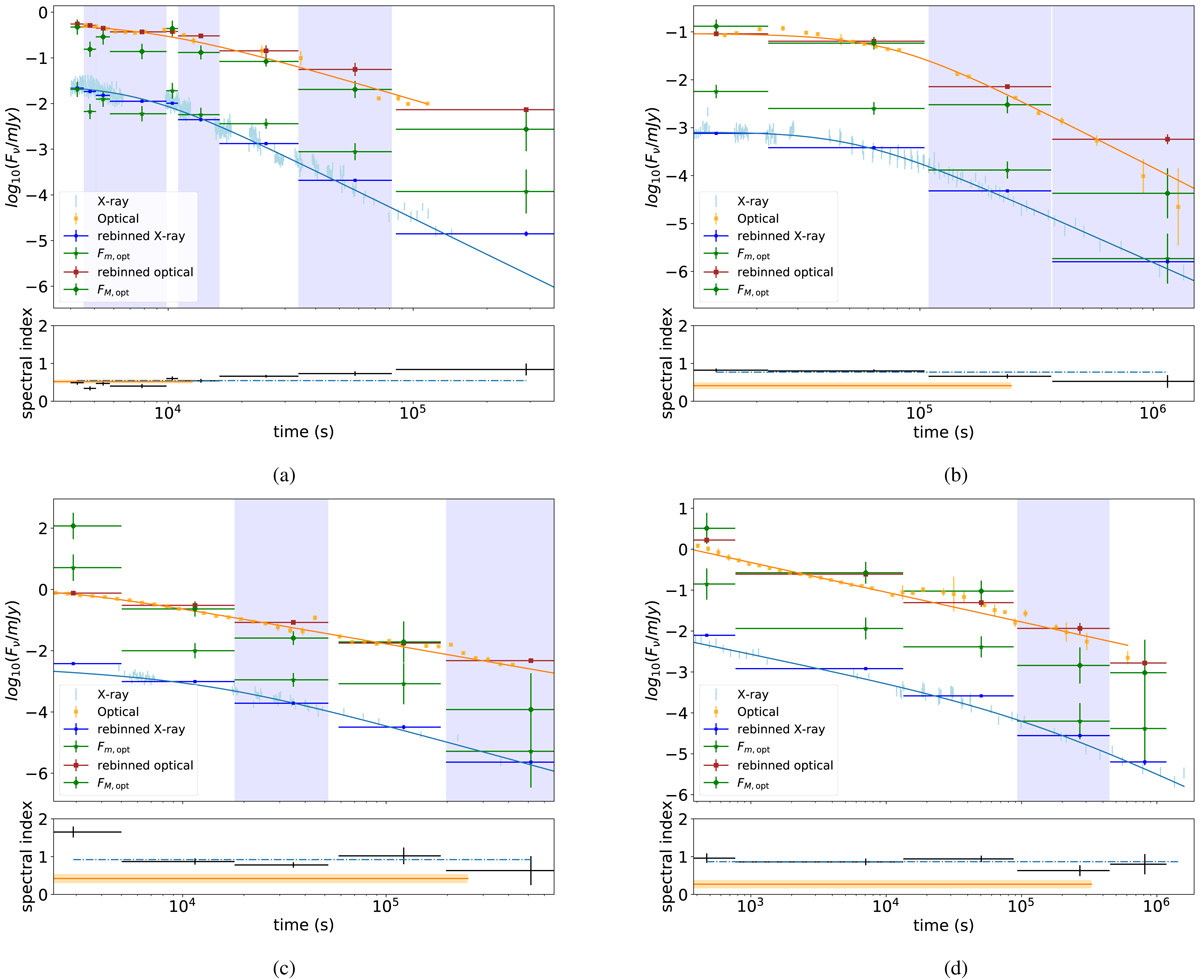
Fig. 3.
Download original image
Summary plots of the GRBs from Sample 2. In this case, for at least one temporal bin, the optical flux is above fM, opt, indicating that optical and X-ray data are not compatible with a single synchrotron spectrum. The symbols are the same as in Fig. 2, and we indicate the temporal bin where fopt > fM, opt with a vertical light blue band. In the bottom panel, we show the X-ray spectral index for each temporal bin with black error bars, while the dot-dashed line is the time-averaged value. In the same sub-plot, we also report the optical spectral index with an orange line (the yellow band is the uncertainty interval). (a) 050730, (b) 060614, (c) 080310, (d) 081007.
Current usage metrics show cumulative count of Article Views (full-text article views including HTML views, PDF and ePub downloads, according to the available data) and Abstracts Views on Vision4Press platform.
Data correspond to usage on the plateform after 2015. The current usage metrics is available 48-96 hours after online publication and is updated daily on week days.
Initial download of the metrics may take a while.