Open Access
Fig. A.1.
Download original image
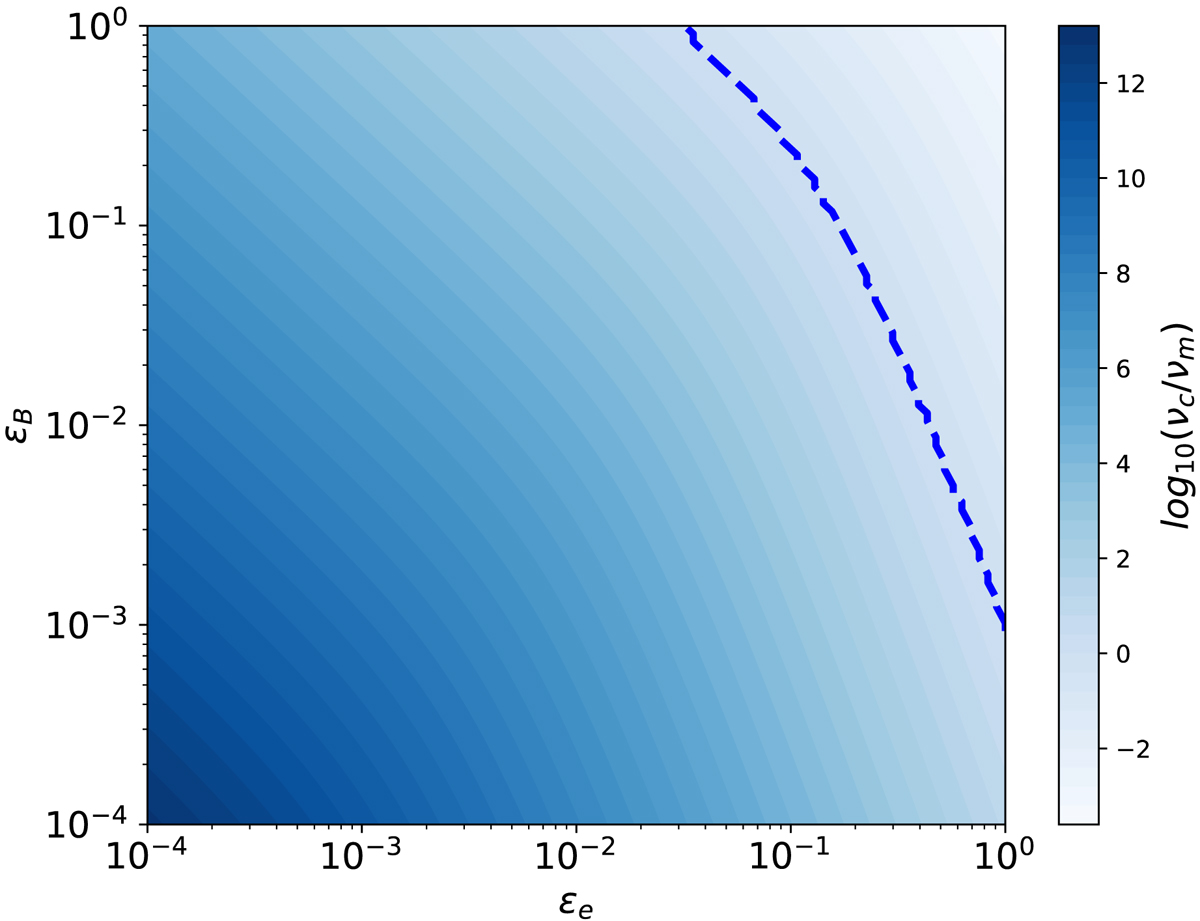
Contour plot of the value of R = νc/νm as a function of ϵe and ϵB. The dashed line corresponds to the combination of ϵe and ϵB, which gives R = 1, and it divides the plane between the slow cooling (bottom left) and the fast cooling (top right) regimes. The region on the right corresponds to the fast cooling regime.
Current usage metrics show cumulative count of Article Views (full-text article views including HTML views, PDF and ePub downloads, according to the available data) and Abstracts Views on Vision4Press platform.
Data correspond to usage on the plateform after 2015. The current usage metrics is available 48-96 hours after online publication and is updated daily on week days.
Initial download of the metrics may take a while.