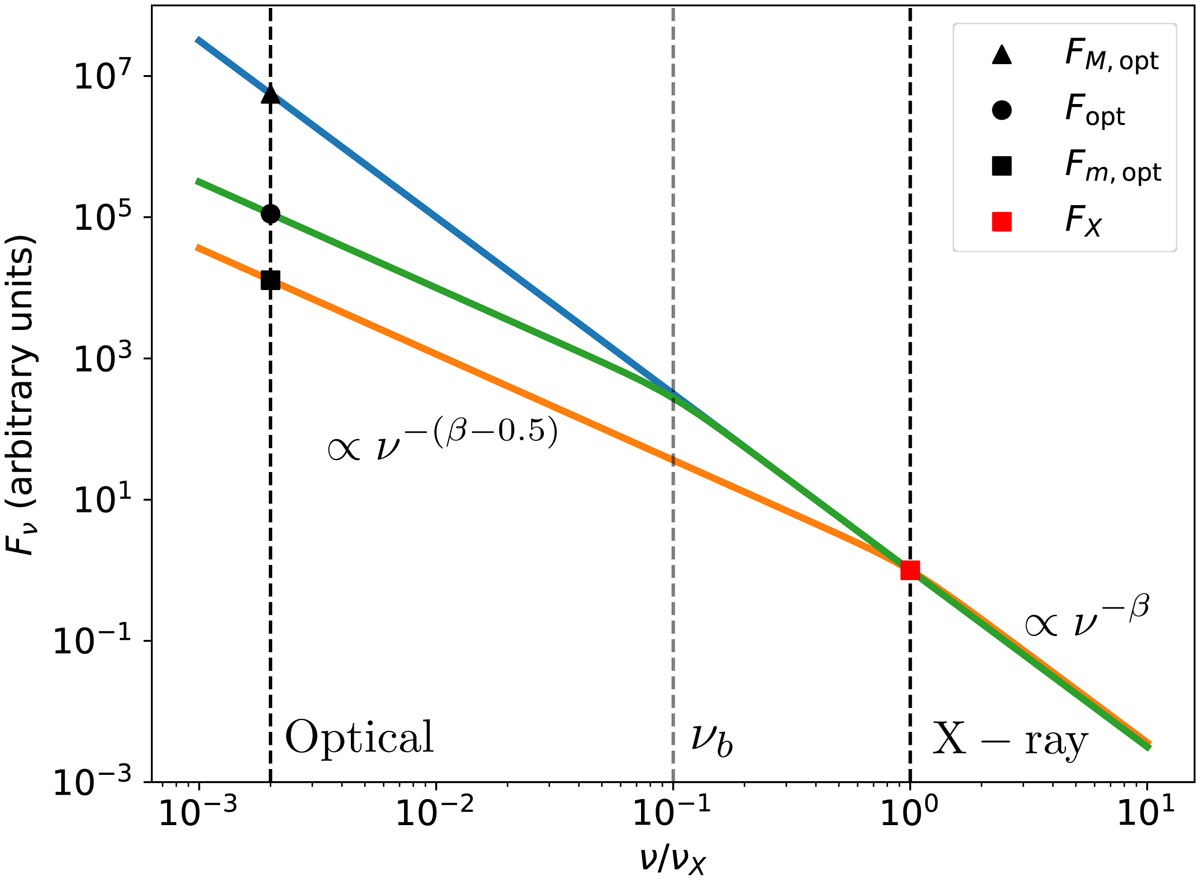
Fig. 1.
Download original image
Schematic representation of the method used to compare X-ray and optical data for each temporal bin. The minimum and maximum optical fluxes allowed by the standard afterglow model assuming that there is a single break νopt < νb < νX are indicated by Fm,opt and FM,opt, respectively. We derived FX, Fopt, and the X-ray spectral slope from spectral analysis. Therefore, if Fm,opt < Fopt < FM,opt, we then considered that the optical counterpart is consistent with a single synchrotron spectrum, and we could derive νb. The blue line has no break, the orange line has νb = νX, and the green line has a break between the optical and X-ray bands. We note that our assumption here is that νm < νopt, and it is supported by the observation of βopt > 0 for all the analysed events (see Sect. 3.2) that exclude the case νb = νm.
Current usage metrics show cumulative count of Article Views (full-text article views including HTML views, PDF and ePub downloads, according to the available data) and Abstracts Views on Vision4Press platform.
Data correspond to usage on the plateform after 2015. The current usage metrics is available 48-96 hours after online publication and is updated daily on week days.
Initial download of the metrics may take a while.