Fig. 5.
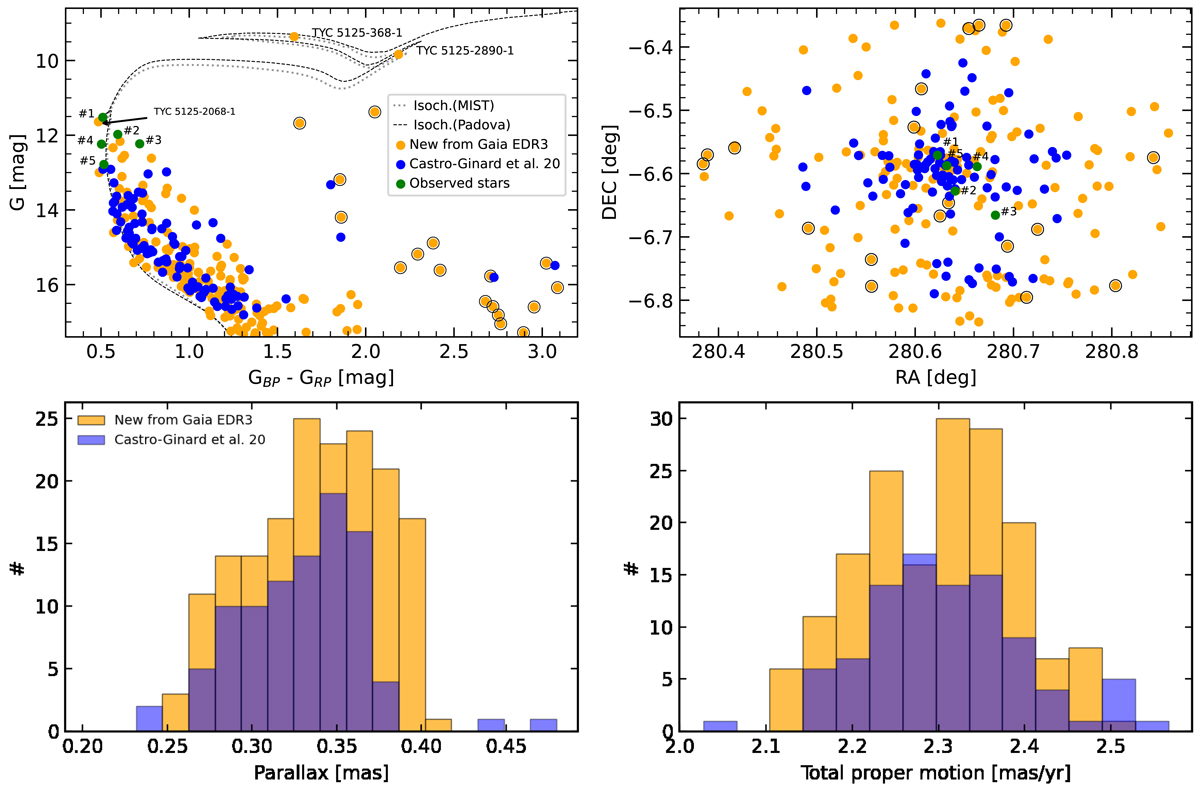
Download original image
Summary figure for UBC 103. Top two figures: colour-magnitude diagram (left) and sky coordinates of the sources (right). Bottom two figures: histograms of the parallax (left) and total proper motion (right). In all figures: blue circles or bins indicate cluster stars listed in Castro-Ginard et al. (2020), here represented by their Gaia EDR3 data; filled green circles are the observed stars; filled orange circles or bins indicate other stars found in Gaia EDR3 within 2σ from the average cluster values (see Sect. 4). Additionally, empty black circles indicate a potential separate population of stars (see Sect. 4.1); the gray dashed and dotted lines correspond to the best fitted isochrones from Padova and MIST databases, respectively, both for a value of 70 Ma and AV = 1.6.
Current usage metrics show cumulative count of Article Views (full-text article views including HTML views, PDF and ePub downloads, according to the available data) and Abstracts Views on Vision4Press platform.
Data correspond to usage on the plateform after 2015. The current usage metrics is available 48-96 hours after online publication and is updated daily on week days.
Initial download of the metrics may take a while.