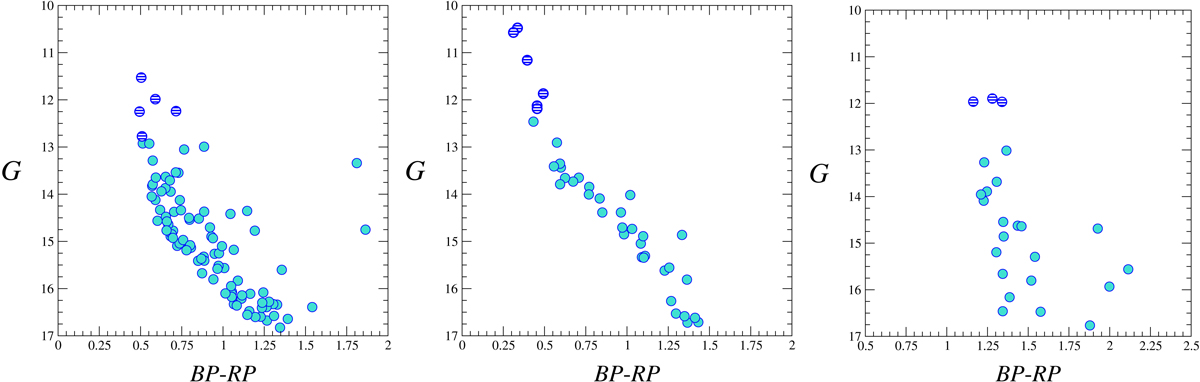
Fig. 4.
Download original image
Raw CMD diagrams for the three clusters observed, based on Gaia photometry. From left to right: UBC 103, UBC 114, and UBC 587 (noting the shift in the horizontal axis due to higher extinction). The large striped circles indicate the stars whose spectra were collected. Cluster members are from Cantat-Gaudin et al. (2020). See main text for details.
Current usage metrics show cumulative count of Article Views (full-text article views including HTML views, PDF and ePub downloads, according to the available data) and Abstracts Views on Vision4Press platform.
Data correspond to usage on the plateform after 2015. The current usage metrics is available 48-96 hours after online publication and is updated daily on week days.
Initial download of the metrics may take a while.