Fig. 10.
Download original image
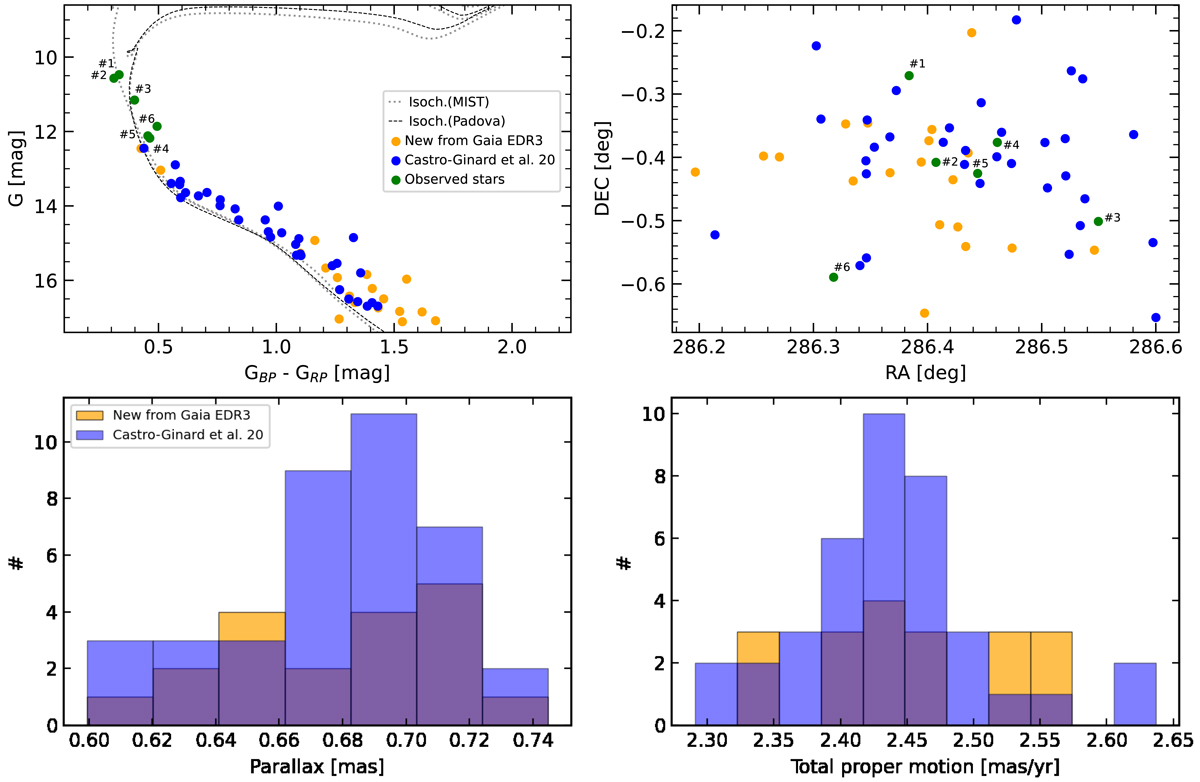
Summary figure for UBC 114. Top two figures: colour-magnitude diagram (left) and sky coordinates of the sources (right). Bottom two figures: histograms of the parallax (left) and total proper motion (right). See Fig. 5 for a description of the symbols and colours. The two grey lines next to each other are isochrones of 100 Ma with AV = 1.2 (the dashed line is a CMD 3.6 isochrone, while the dotted line is from the MIST database). Dotted line to the left of the others corresponds to a 26 Ma isochrone with AV = 1.3, taken from MIST. The data seem to favour the younger age.
Current usage metrics show cumulative count of Article Views (full-text article views including HTML views, PDF and ePub downloads, according to the available data) and Abstracts Views on Vision4Press platform.
Data correspond to usage on the plateform after 2015. The current usage metrics is available 48-96 hours after online publication and is updated daily on week days.
Initial download of the metrics may take a while.