Open Access
Fig. 5.
Download original image
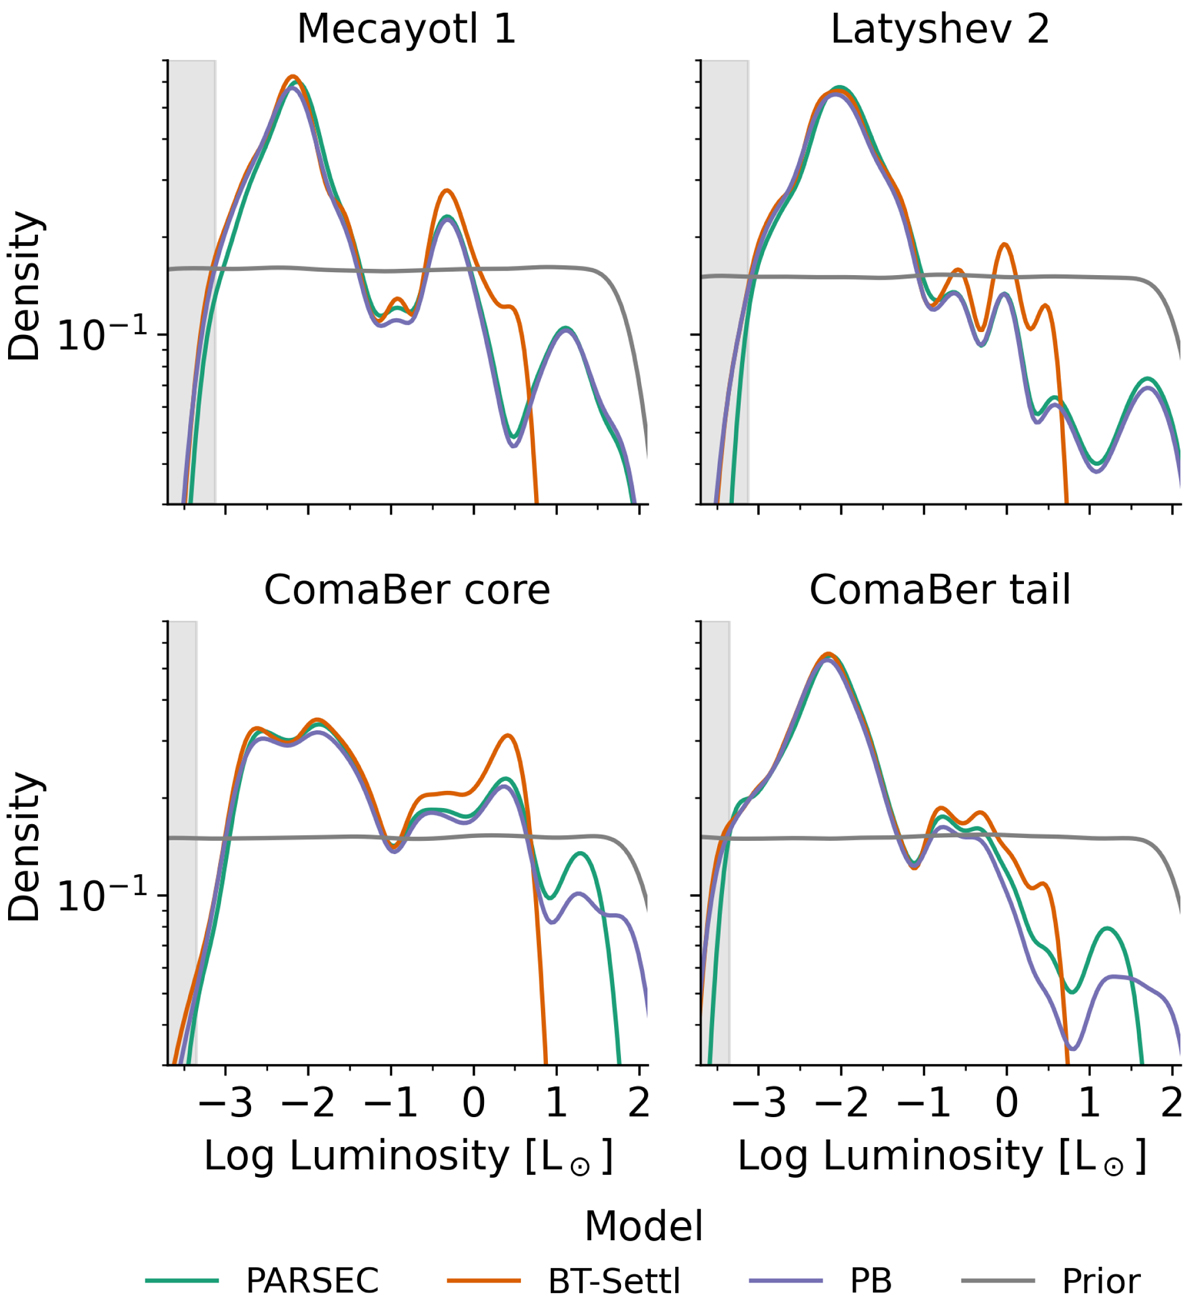
Luminosity distributions inferred with different theoretical models. The grey line and grey region depict the uniform prior and the completeness limit of the Gaia data. This latter corresponds to apparent G mag ∼19 transformed to luminosity using the mean group distance and BT-Settl model.
Current usage metrics show cumulative count of Article Views (full-text article views including HTML views, PDF and ePub downloads, according to the available data) and Abstracts Views on Vision4Press platform.
Data correspond to usage on the plateform after 2015. The current usage metrics is available 48-96 hours after online publication and is updated daily on week days.
Initial download of the metrics may take a while.