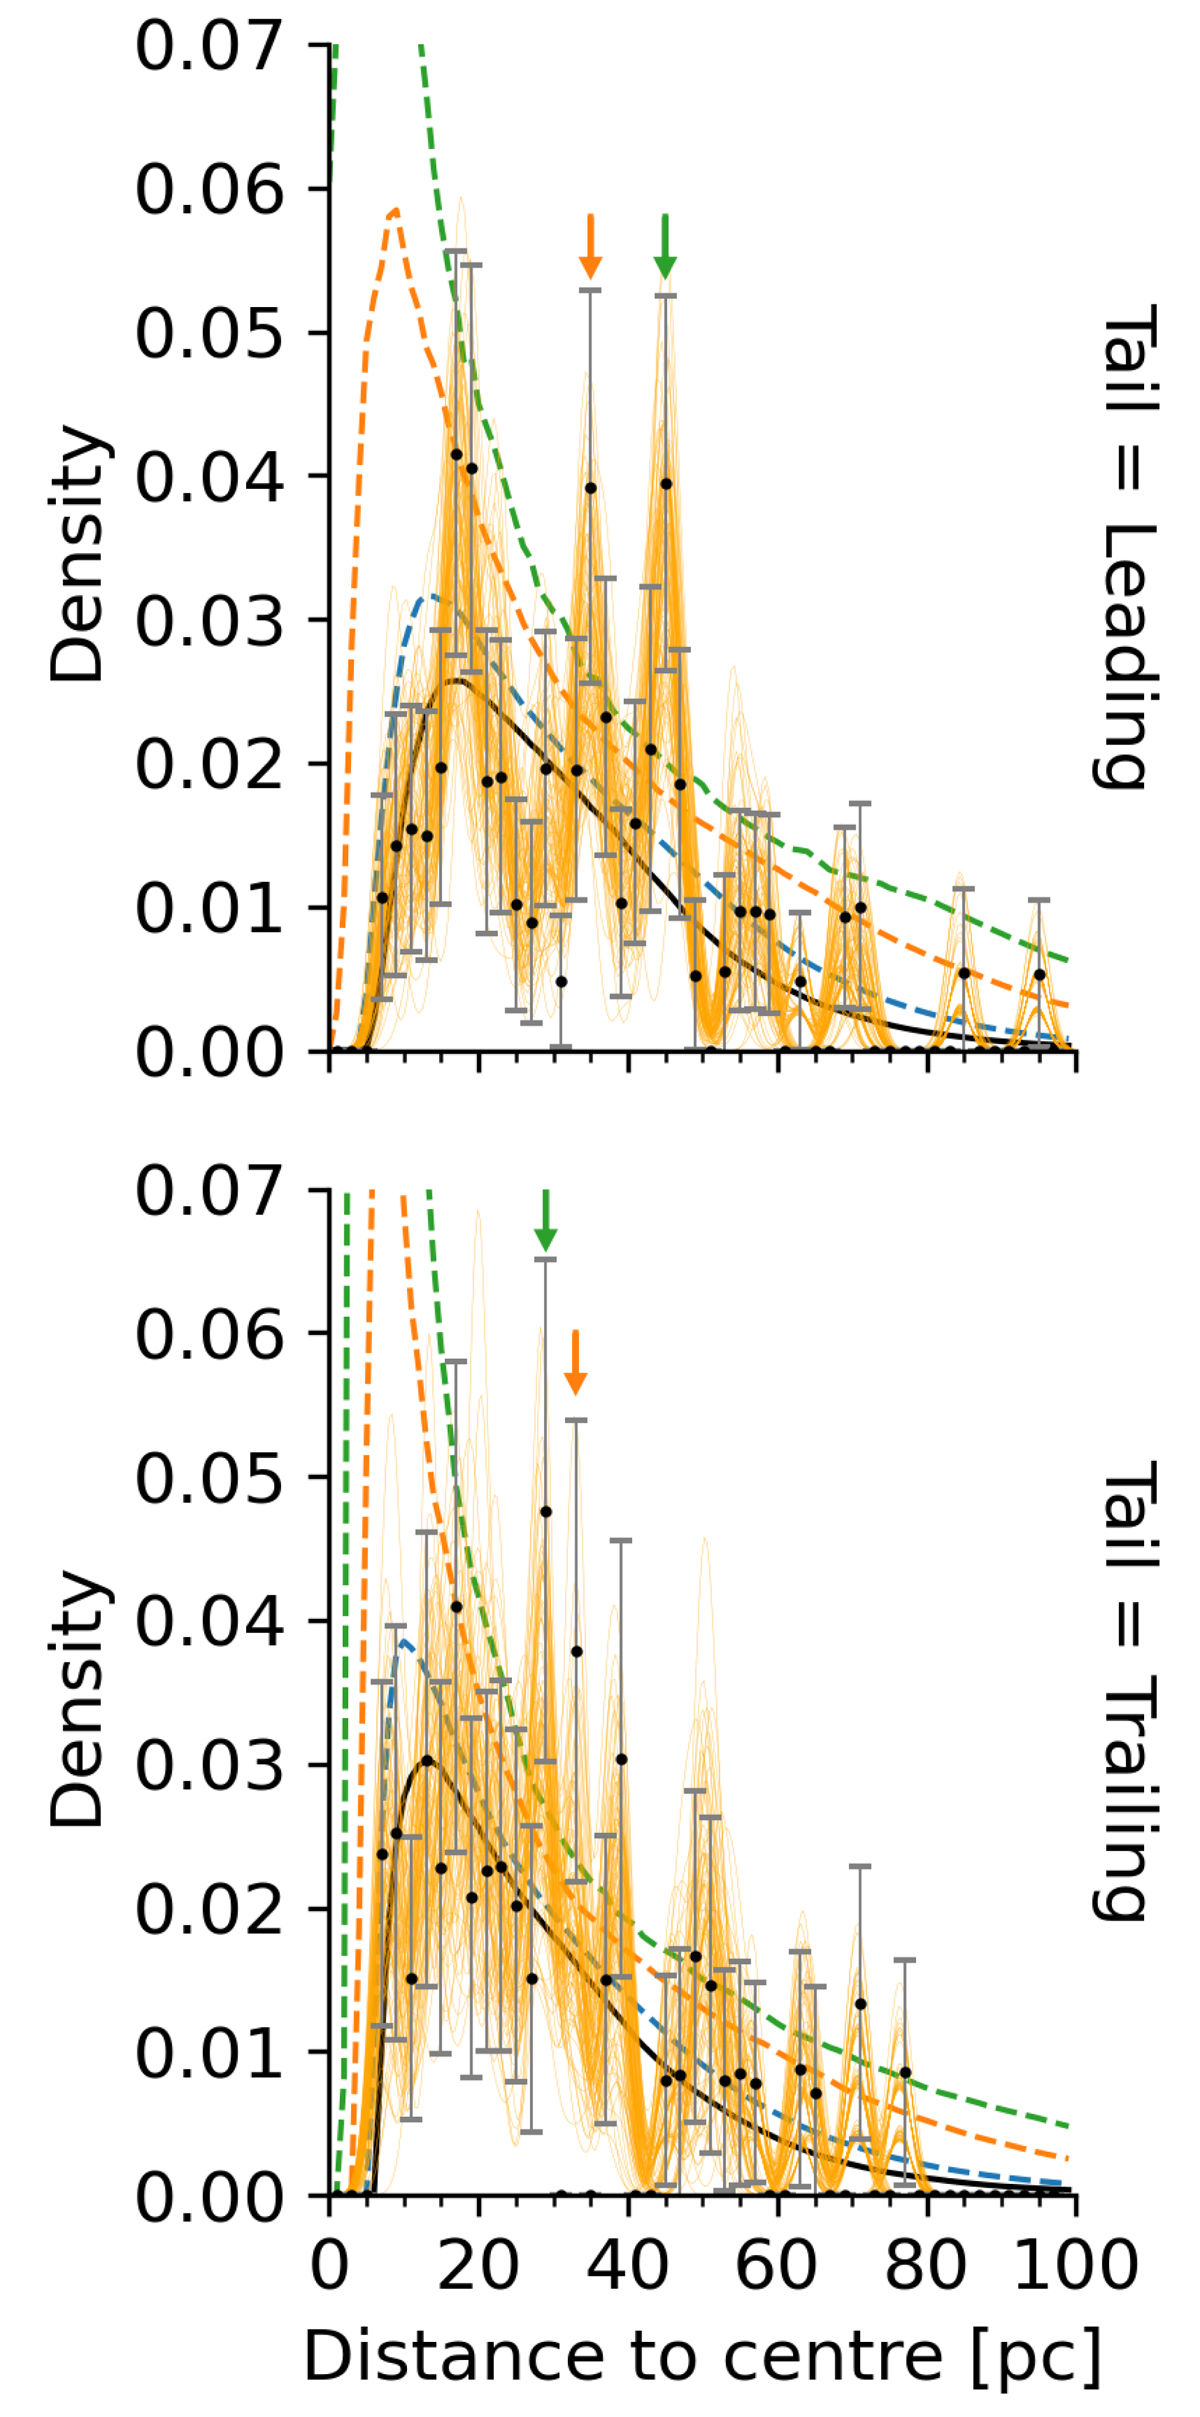
Fig. 15.
Download original image
Distance-to-centre distribution of Coma Ber’s leading and trailing tail members. The orange lines depict the kernel density estimate of samples from the radial distance while the black dots and grey bars depict radial bins mean and standard deviation of 100 bootstrap realisations from the tail’s members. A Gamma distribution was fitted to these bootstrap realisation and its median value (black solid lines) and one-sigma (blue dashed lines), two-sigma (orange dashed lines) and three-sigma (green dashed lines) confidence intervals are also plotted. The vertical arrows indicate the radial bin with densities exceeding the two-sigma (orange arrows) and three-sigma (green arrows) levels.
Current usage metrics show cumulative count of Article Views (full-text article views including HTML views, PDF and ePub downloads, according to the available data) and Abstracts Views on Vision4Press platform.
Data correspond to usage on the plateform after 2015. The current usage metrics is available 48-96 hours after online publication and is updated daily on week days.
Initial download of the metrics may take a while.