Open Access
Fig. 9.
Download original image
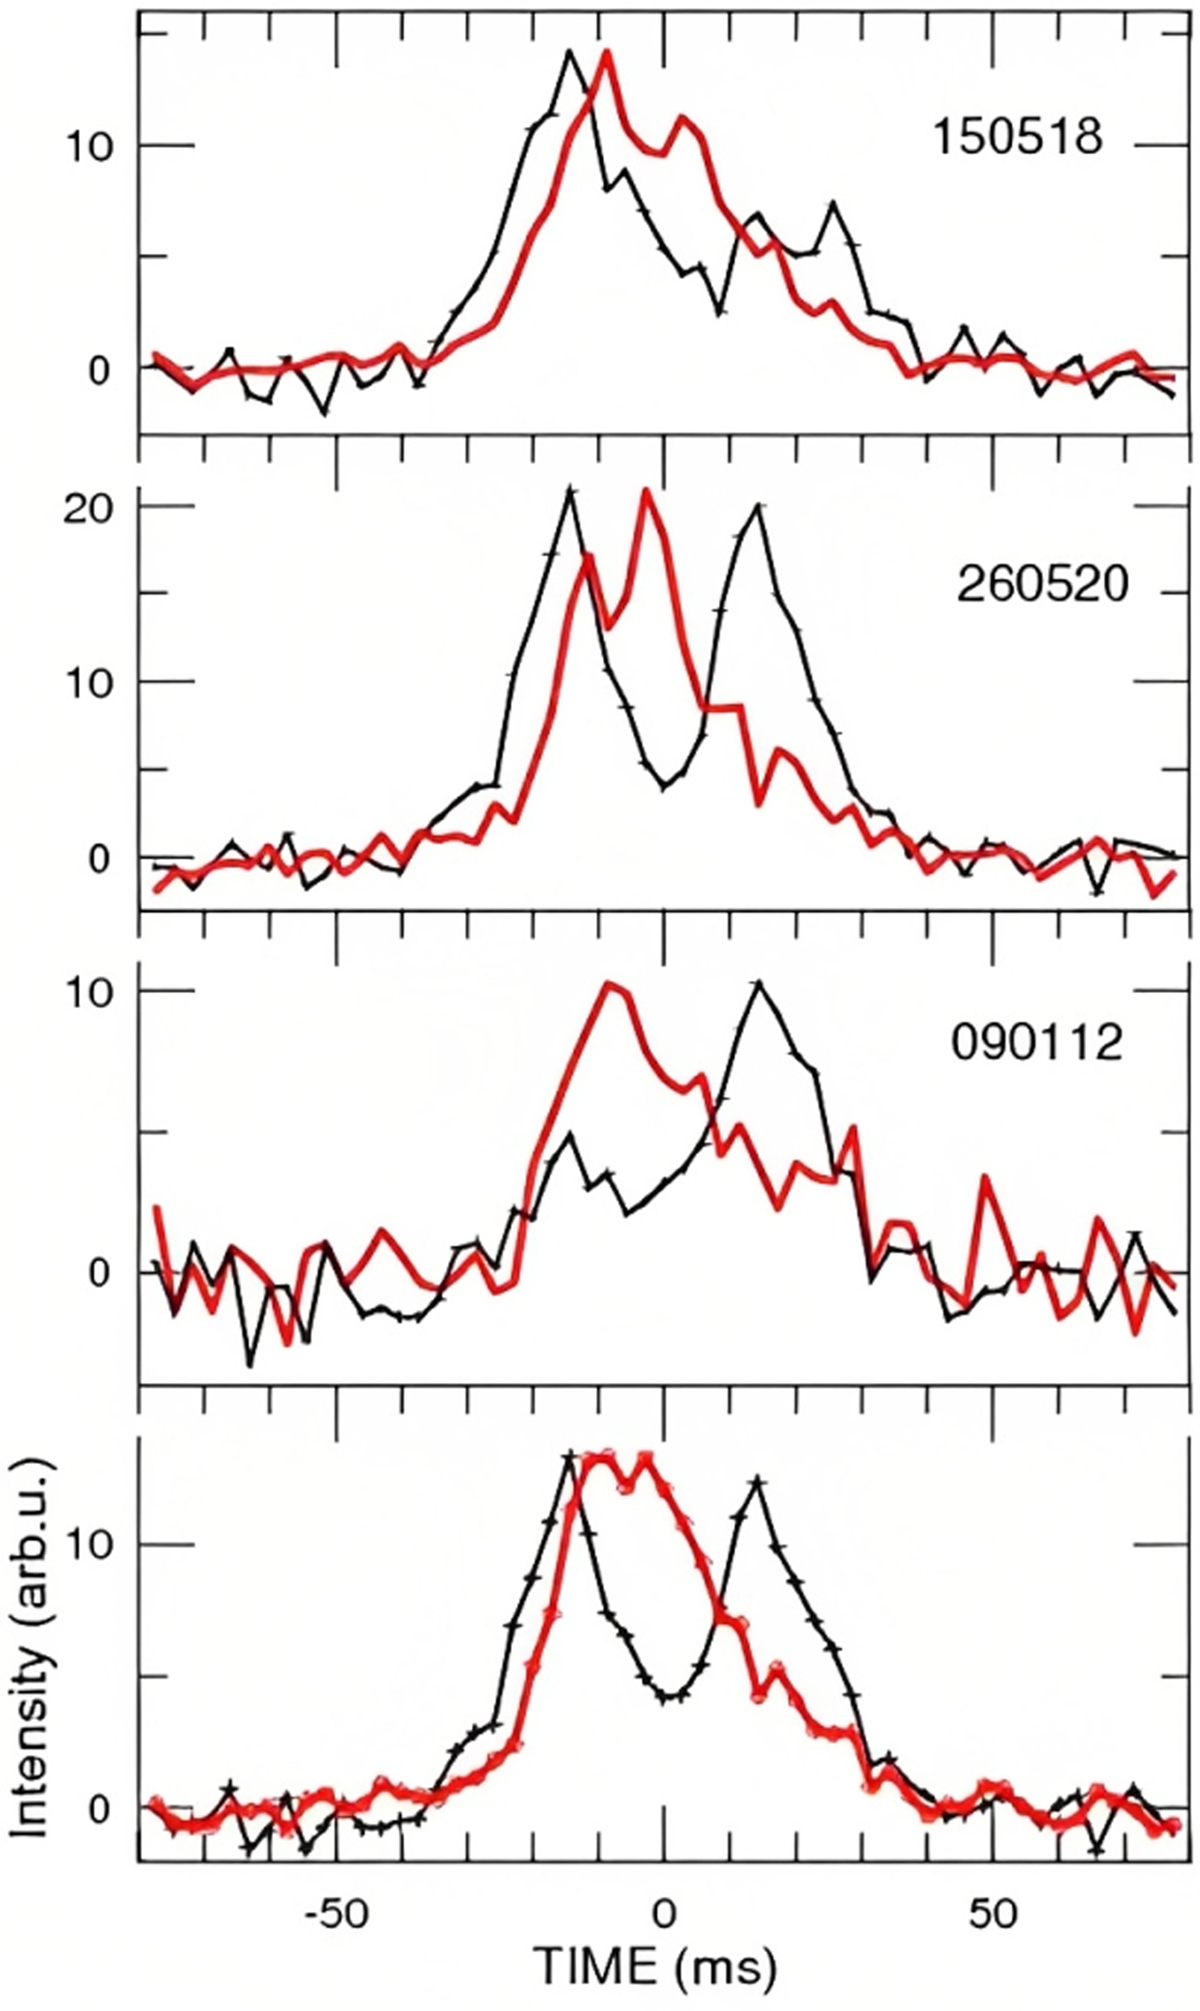
Average pulse shape of the Tb mode (red line) and the B mode (black line with crosses) for sessions (from top to bottom) 150518, 260520, and 090112. Profiles for different days were aligned by the leading peak of B-mode profile. The lowest panel shows profiles averaged over these three sessions.
Current usage metrics show cumulative count of Article Views (full-text article views including HTML views, PDF and ePub downloads, according to the available data) and Abstracts Views on Vision4Press platform.
Data correspond to usage on the plateform after 2015. The current usage metrics is available 48-96 hours after online publication and is updated daily on week days.
Initial download of the metrics may take a while.