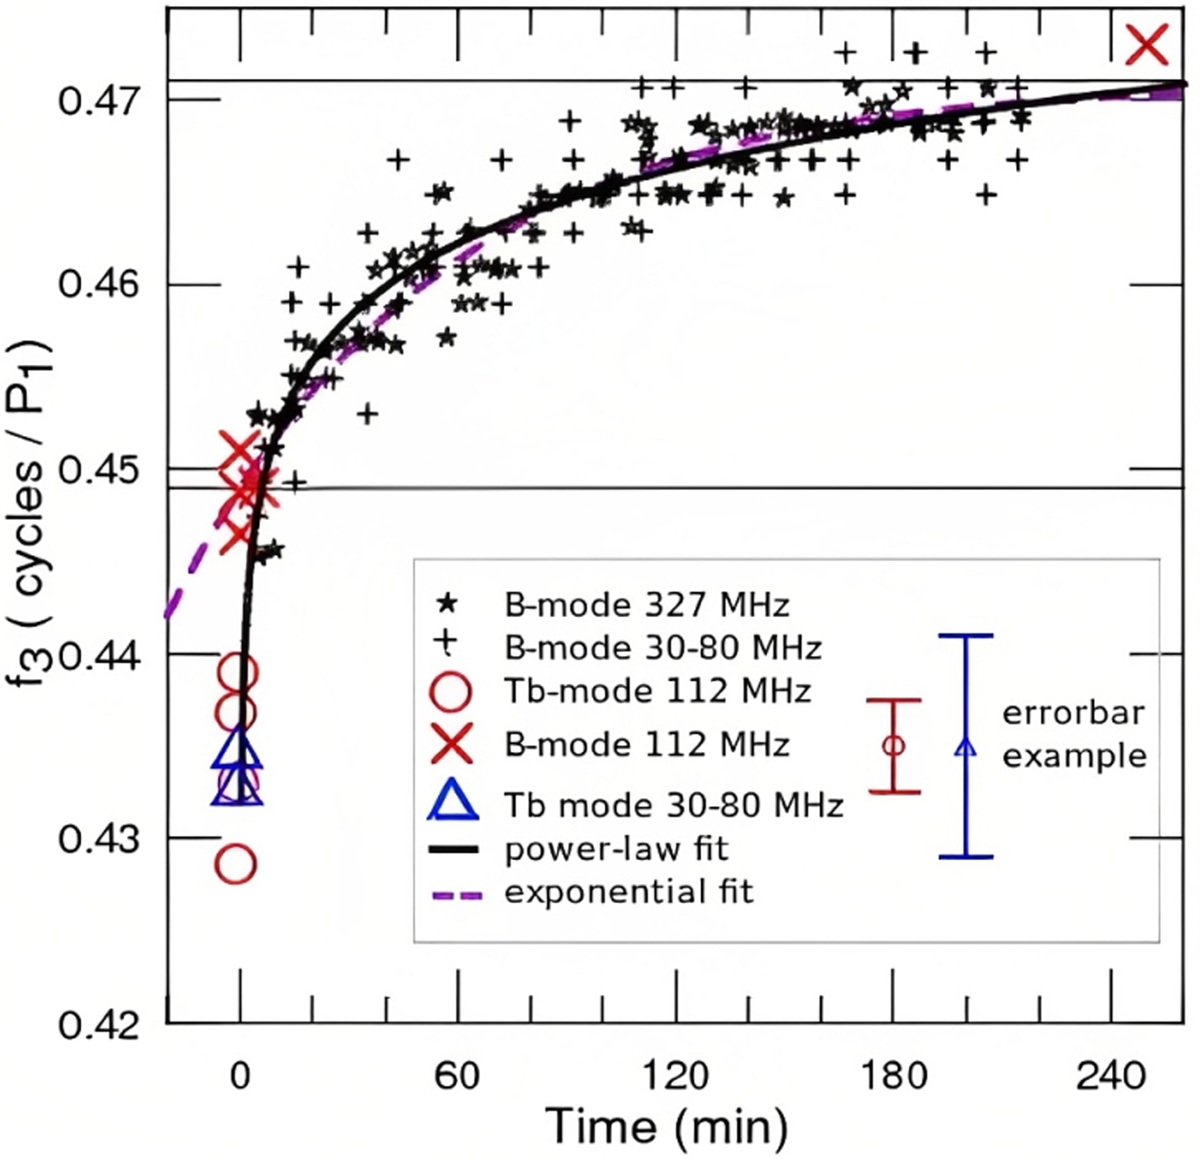
Fig. 7.
Download original image
Compilation of observed f3 values as a function of time since B-mode onset. Previously published f3 measurements are shown by black stars (Arecibo, 327 MHz) and black crosses (LOFAR, 30−80 MHz). The 112 MHz measurements for the Tb and B modes from this work are shown with red circles and crosses. The f3 value for 91 B-mode pulses right before a B-to-Q mode transition (session 221219) is plotted at an arbitrary time mark of 250 min. LOFAR Tb-mode f3 measurements are shown with blue triangles. The points around t = 180 min show typical f3 error bars for PRAO and LOFAR measurements from this work. Horizontal lines mark the range of validity of the exponential fit by Backus et al. (2011, dashed magenta line). The black line shows the power-law fit from Suleymanova & Pugachev (2017). The measurements for the Tb mode agree well with a power-law fit.
Current usage metrics show cumulative count of Article Views (full-text article views including HTML views, PDF and ePub downloads, according to the available data) and Abstracts Views on Vision4Press platform.
Data correspond to usage on the plateform after 2015. The current usage metrics is available 48-96 hours after online publication and is updated daily on week days.
Initial download of the metrics may take a while.