Fig. 5.
Download original image
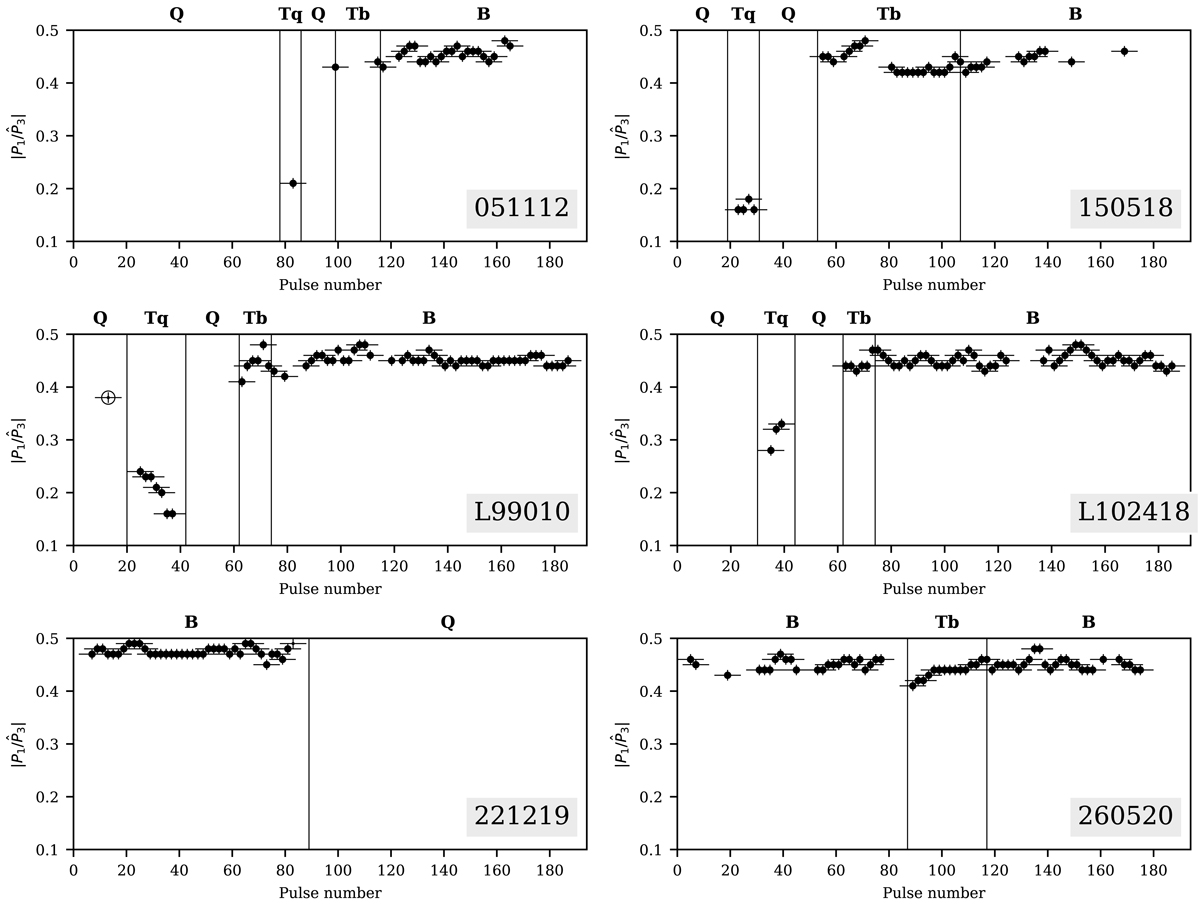
Absolute value of the modulation frequency around the lines of constant spin phase (![]() ) as a function of time for the pulse sequences from Fig. 2. Horizontal error bars mark the edges of the ten-pulse samples used for f3 calculation. Vertical error bars show the nominal frequency determination error taking into account the zero-padding. For each subsample, only f3 with the highest S/N is plotted (see text for details on S/N estimates). Only peaks that were stronger than 99.5% of the simulated sample are shown. The vertical lines mark the mode edges. All points here correspond to negative
) as a function of time for the pulse sequences from Fig. 2. Horizontal error bars mark the edges of the ten-pulse samples used for f3 calculation. Vertical error bars show the nominal frequency determination error taking into account the zero-padding. For each subsample, only f3 with the highest S/N is plotted (see text for details on S/N estimates). Only peaks that were stronger than 99.5% of the simulated sample are shown. The vertical lines mark the mode edges. All points here correspond to negative ![]() except for the empty point for session L99010. For the PRAO sessions, the absence of f3 points near the observation end is due to pulsar signal attenuation.
except for the empty point for session L99010. For the PRAO sessions, the absence of f3 points near the observation end is due to pulsar signal attenuation.
Current usage metrics show cumulative count of Article Views (full-text article views including HTML views, PDF and ePub downloads, according to the available data) and Abstracts Views on Vision4Press platform.
Data correspond to usage on the plateform after 2015. The current usage metrics is available 48-96 hours after online publication and is updated daily on week days.
Initial download of the metrics may take a while.